Find out how you can identify accumulation and distribution with price action trading. Spot the footprints left by “smart money” with price and volume, the Wyckoff method way, when day trading or swing trading the stocks and futures. Join today and be part of the lifetime community group.
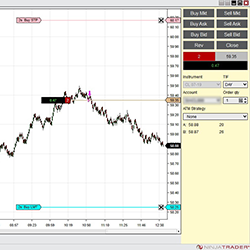
This robust pattern recognition strategy for day trading futures, stocks and FX has been used for Crude Oil futures trading since November 2017. It includes fully customizable parameters based on your individual risk tolerance level. Contact us to lease/purchase or explore synergistic opportunities.
Unlock the secrets of successful trading with the latest version of the Order Flow Trading Setups eBook. Dive into over 12 unique order flow setups, each detailed with examples and entry points. This guide offers practical setups used in daily trading and clear screenshots for each pattern.
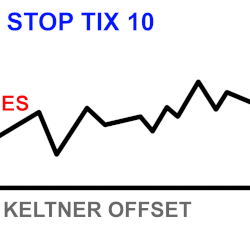
Stop Keltner uses Keltner Band distance to help give an estimated stop-loss in ticks, which is displayed in an easy-to-read text box on the chart. It’s also an excellent backtesting tool for getting estimated stops when identifying past trade entries on historical bars. Built for ES momentum traders
Need a custom indicator, tool or strategy? Integrity-Traders offers a NinjaScript development service aimed at creating tools and indicators with a polished look and feel, precise operation and well documented parameters descriptions. Contact Integrity-Traders today!
This intelligent indicator will help you predict pullbacks and trend reversals. It uses an innovative form of volatility divergence which helps create consistency. In addition to smart signals and performance statistics, the Divergence Cloud also displays a unique glowing cloud on the chart.
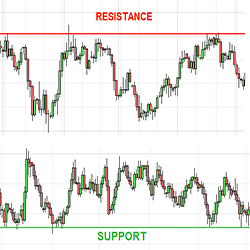
Plots chart and/or synthetic support and resistance lines from a higher time frame.
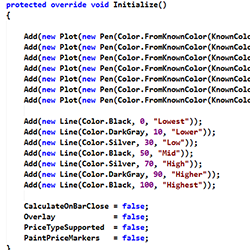
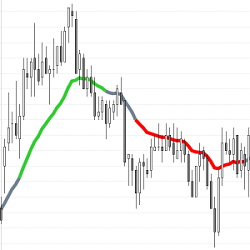
This indicator uses recent bar closes to calculate the “Always In” direction to help traders determine market trends. Use the Simple Always In EMA as a discretionary indicator or for automated trading. It is FREE to download and use!
Fear and anxiety are common trading emotions. They can turn an otherwise profitable strategy into one that is constantly losing. The goal of Traderistic is to put an end to this frustration by monitoring the body and raising awareness of stress so that one can begin trading to their full potential.
Elevate your trading strategy with the ATS Average Volume Pro indicator. This powerful tool showcases average volume with a customizable Simple Moving Average (SMA) and highlights each bar with above-average volume, making it easier for you to spot significant market moves.
December 2, 2024
Mastering Sideways Markets With Auction Bars and Range Projections
November 19, 2024
Enhancing Your Automated Trading System: Key Insights from Best Pro Trade
November 14, 2024
NinjaTrader New Ecosystem Tools: October 2024 Edition
Enter Email for Updates