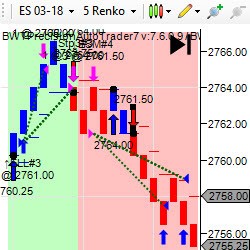
The BWT Precision Autotrader is a state of the art trading tool/software that automates most of the tasks of manual trading, like trail stops, daily goals, entries and profit targets. It uses a universal directional algorithm that brings accuracy, discipline, risk & money management to your trading.
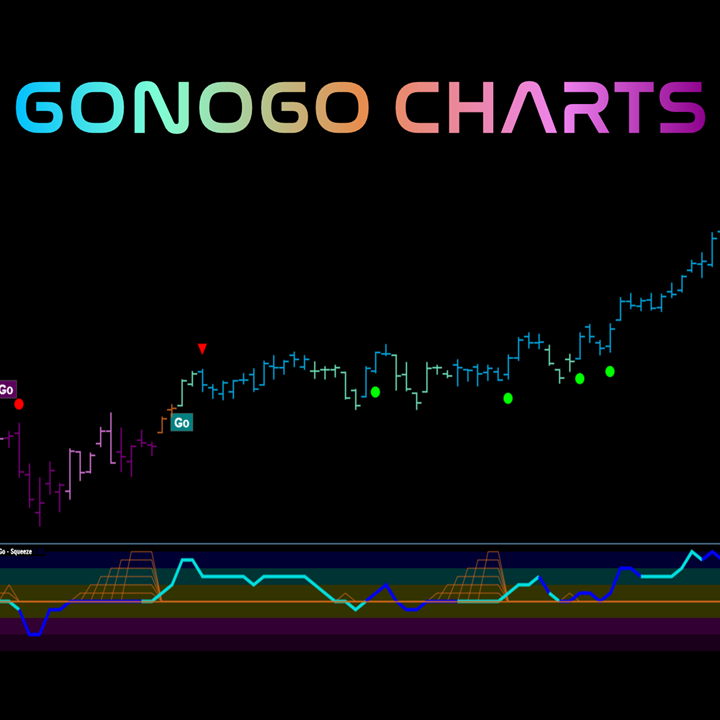
GoNoGo Charts® incorporates multiple widely tested and commonly used technical indicators into proprietary trend and momentum models for a complete technical perspective without cluttering your charts. GoNoGo Trend® is a model that includes tools like multiple period moving averages and more.
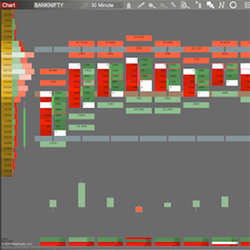
The Bell Order Flow-PRO is a toolkit of optimized order flow and volume visualization. It offers some of the unique features like BidxAsk Ladders, High Volume Alert, Volume Imbalance, Volume Spread Analysis, Delta Candles, Volume Profile, COT, Contract Reversal and customizable chart colors.
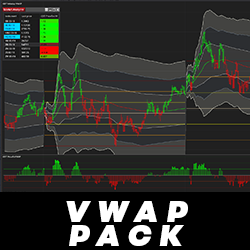
The VWAP Pack includes a VWAP Indicator with current and previous levels, a Price to VWAP indicator to output the position of price, and a Market Analyzer template! With the Price to VWAP indicator, it is easy to monitor the position of price in relation to the current VWAP.
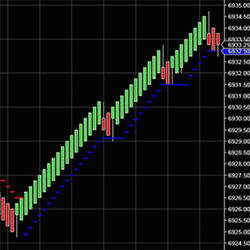
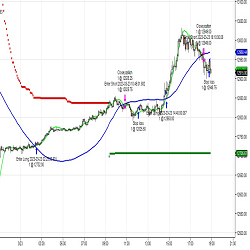
Trailing Stops move with the price action, not a lagging indicator. The indicator was designed for traders to use and to have no hassles of calculating your stop losses. The software does it automatically; never second guess the trend again. Can be used to lock in and protect your profits.
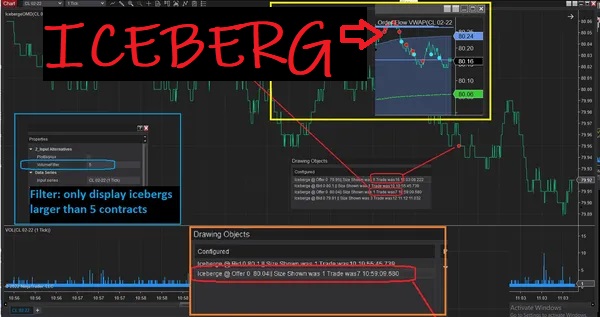
Detect sophisticated large traders, attempting to obfuscate their trading by only posting or displaying a portion of their order size. Indicator will highlight prices on a chart where iceberg was used and for how many contracts.
Fear and anxiety are common trading emotions. They can turn an otherwise profitable strategy into one that is constantly losing. The goal of Traderistic is to put an end to this frustration by monitoring the body and raising awareness of stress so that one can begin trading to their full potential.
Bstrader-automatic is a powerful trend following automated trading system. It has customizable parameters, different position sizing methods, fixed size, equity percentage, atr, price percentage, ATR Trailing Stop, Market Money Scale In and Scale Out, Volatility Compass, Daily loss limit and more.
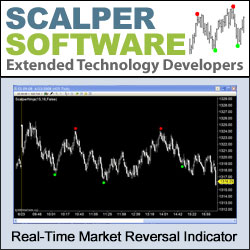
Scalper Pivot Point allows traders to identify turning points, and aids in spotting trends and reversals. It can be loaded on any data-compression type of chart. When several conditions met, a signal is plotted on the user’s chart. See samples of the Scalper Pivot Point in action on NinjaTrader!
The Flow of fund(FOF) divergence signal indicator consists of the following parts: The Flow of fund histogram, FOF trend line, back test result in sub chart and divergence signal in main chart. The signal is instantly drawn on current bar and will not repaint.
December 2, 2024
Mastering Sideways Markets With Auction Bars and Range Projections
November 19, 2024
Enhancing Your Automated Trading System: Key Insights from Best Pro Trade
November 14, 2024
NinjaTrader New Ecosystem Tools: October 2024 Edition
Enter Email for Updates