Dynamic Accumulation & Distribution plots graphically and numerically, how many times a price region has been tested. Levels tested more will appear as deeper lines, and levels tested less will appear as narrower lines, instantly revealing the depth of any accumulation or distribution region.
Tradesight posts regular weekly market previews and trade recaps on their YouTube page. The service is free.
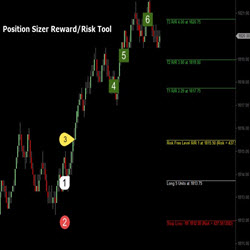
This tool auto-calculates position size based upon account value and percentage risk parameters input by trader. Displays the Entry Price, Stop Loss, and up to Three (3) Price Targets based on R-values. If you a serious trader, then this is an essential addition to your trader toolbox.
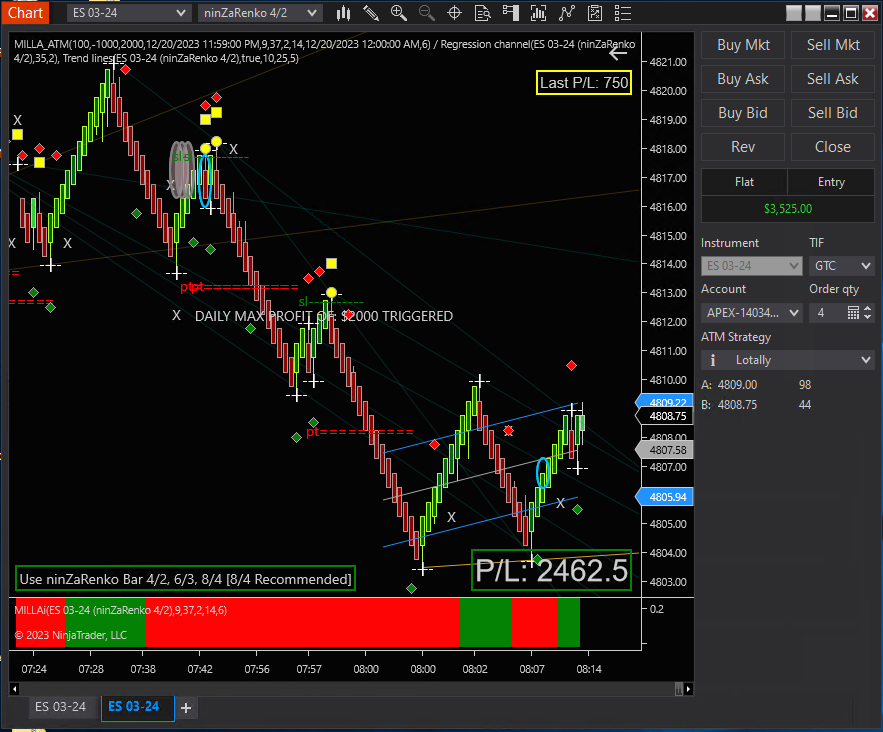
An indicator with automated entry notification along with entry, stop loss and profit target spot included.
This chart analysis package helps you move forward quickly, detecting opportunities and enhancing trading decisions. Trade with greater confidence and consistency. Quick-to-learn, rules-based strategy. Email alerts so you don’t miss an opportunity. Management tools help entering or exiting a trade.
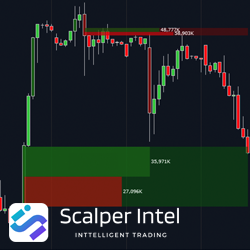
The Fair Value Gap (FVG) from ScalperIntel is an indicator that identifies inefficiencies (or imbalances) in the market and then marks the upper and lower limits of the gaps. The Bull and Bear FVG’s are plotted along with the bull/bear volume profile from the gap start.
ElliottWaveTrader offers a live Trading Room of market analysis, based on Elliott Wave principle. Founded in 2011, the site benefits traders looking to anticipate the direction of U.S. & world equity indices, stocks, bonds, metals, energy & more over a time horizon of several days to several months.
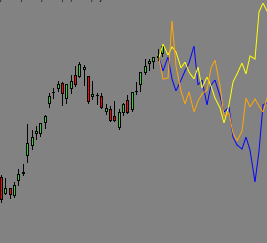
This drawing tool provides insight into future price movements by projecting the previous three years data forwards in simple to read color-coded plots. No guessing, no predictions, just the reality of what happened before. Expensive product for the serious trader.
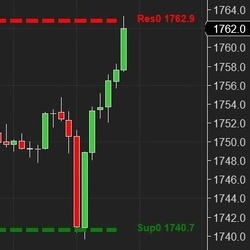
Based on an Artificial Intelligence (AI) engine, the E.G. Trigger Point calculates support and resistance (S&R) lines. The S&R are specific price points on a chart expected to attract the maximum amount of either buying or selling.
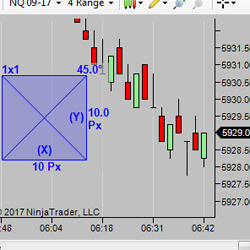
This tool is a valuable visual aid for traders who use Gann, Fibonacci, Point and Figure charts and want to see true angles. Simply load it on the chart and push the toolbar button when you want to use it, then adjust an axis until the chart is square. Using the 'Keep Centered' option will then keep price in the chart area while the chart is squared.
December 2, 2024
Mastering Sideways Markets With Auction Bars and Range Projections
November 19, 2024
Enhancing Your Automated Trading System: Key Insights from Best Pro Trade
November 14, 2024
NinjaTrader New Ecosystem Tools: October 2024 Edition
Enter Email for Updates