Master back-testing in algorithmic and quant trading with their dual course bundle. Learn essential techniques and advanced methods to optimize your trading strategies. Validate and optimize your trades with systematic, quantitative approaches. Start building your trading edge today! Sign up now!
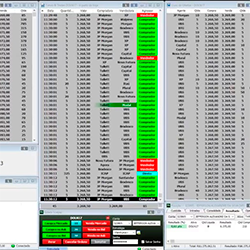
Manage your risk by setting drawdown limits and goals! If your drawdown limits are hit, the system prevents you from trading further. If your goal is hit, you can trade but never giving back more than your set amount. If hit, you're done for the day/week. This is your preset Dynamic Drawdown Limit.
Professional-grade, lightning-fast trading system that self-adjusts to the current volatility conditions as it trades the re-emergence of momentum on modern financial markets. Available in standalone and Bloodhound versions. Built rock-solid for NT8.
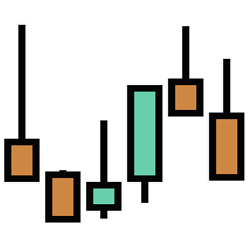
Delta Polar Bars are a new Order Flow bar type built on polarity between delta and volume. They finely distinguish balance/imbalance zones and produce specific intra-bar delta patterns which help to identify reversal/trend continuation.
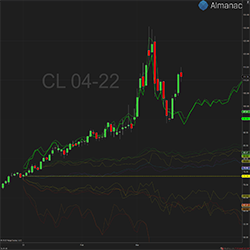
Accrue Inc. didn’t invent seasonality – they just made it easier to see and trade! Almanac™ Calendar Analytics creates better awareness of seasonality with 90-day price projections across five different market scenarios.
Our Dedicated Programmer service is ideal for medium and long-term projects. If you need continuous software development, we recommend a dedicated programmer solution. A personal programmer will address all of your requirements at a reasonable monthly rate.
This course was designed with the objective of deeply studying the U.S Dollar futures contract in Brazil, techniques of operation using order flow, structuring of reasoning and strategies, self-knowledge and behavior adaptation for professional and consistent day-to-day evolution.
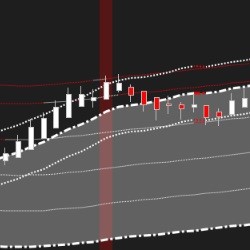
The Linear Regression Trend Lines Indicator dynamically balances the trend on your chart on all time frames. This indicator is built from several linear regression indicators and modified Keltner Channels. Set up to five offset multiplier levels for targets or reversals.
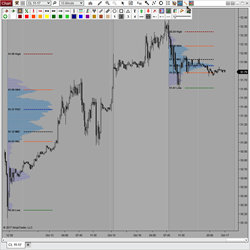
VPD is a custom drawing tool that dynamically draws volume profiles anywhere on your chart. It features 3 Modes of Calculation and displays 6 Levels of Significance (VPOC, VA's, High/Low/Mid) as well as a profile summary. It utilizes a unique context menu and is global drawing & template capable.
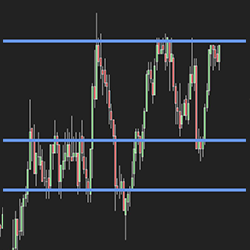
Support/Resistance Levels can be tedious to look for. You have to go back on your chart (with a changing Y axis), and it can be hard to spot every significant point of contact. Tyche Trading’s Automatic S/R Indicator eliminates that with a high level of precision. Get a seven-day free trial today!
December 2, 2024
Mastering Sideways Markets With Auction Bars and Range Projections
November 19, 2024
Enhancing Your Automated Trading System: Key Insights from Best Pro Trade
November 14, 2024
NinjaTrader New Ecosystem Tools: October 2024 Edition
Enter Email for Updates