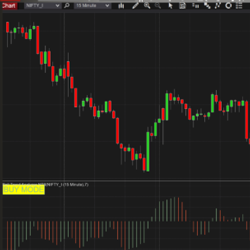
The Bell Trend Analyzer provides directional bias for a trader and helps identify early trend formation. Bars are colored for quick trend identification with proper text annotations.
The Helix strategy is the combination of our Entry Zone indicator and the Trade Management strategy, hence the name Helix (or double Helix). Helix allows you to create your Entry Zones based on your setup rules. Then, after trade execution, Helix will manage the trade based on your rules.
The Ultimate Pivot Points™ (UPP) Indicator Package is the most advanced and extensive collection of “Pivot Points” Indicators available. It includes every “Pivot Point” method along with several innovative features — making it one of the most complete Support/Resistance indicators on the market!
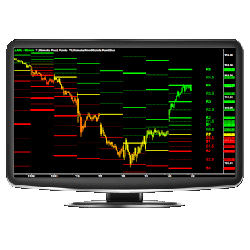
The Exhaustion Absorption Detector, which is based on live time and sales data, is designed to display order activity between the bid and offers at market price.
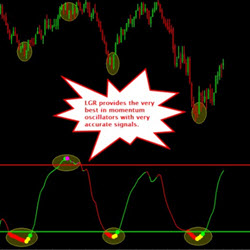
The LGR is a composite Triple Momentum Index Oscillator. LGR indicator is a proprietary design that gives the trader the crème de la crème of momentum oscillators by combining into a single indicator. No more figuring out which oscillator to choose.
Creating custom algorithmic trading solutions that provide out of the box edge.
For new or current traders who wish to learn what it takes to gain knowledge and confidence to become more consistent in their trading, this course includes the following sections: Price Action Mastery Overview, Price Action Q&A Recorded Webinar, Understanding Market Sentiment & a Trader Assessment.
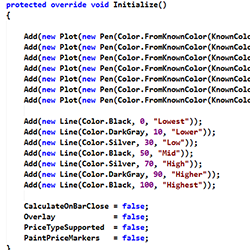
Learn to code automated strategies, indicators and add-ons for NinjaTrader 8. Join our NinjaScript custom programming course. No prior programming knowledge is required. Learn from beginner to expert level in live sessions tailored for custom NinjaScript programming.
Need a custom indicator, tool or strategy? Integrity-Traders offers a NinjaScript development service aimed at creating tools and indicators with a polished look and feel, precise operation and well documented parameters descriptions. Contact Integrity-Traders today!
This NinjaTrader indicator is programmed to highlight the big money trades. The numbers are placed under each bar which makes it easy to see where the action/noise is taking place.
December 2, 2024
Mastering Sideways Markets With Auction Bars and Range Projections
November 19, 2024
Enhancing Your Automated Trading System: Key Insights from Best Pro Trade
November 14, 2024
NinjaTrader New Ecosystem Tools: October 2024 Edition
Enter Email for Updates