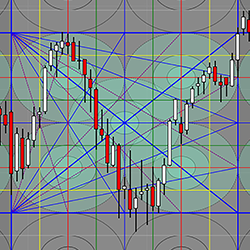
The Samri Math Diamond Grid is a drawing tool which is applied by drawing a square on a chart. The tool then automatically displays graphic elements which are based on calculations from the methodologies of Gann & Murrey.
The ST Inside Bars visually displays when a time-based bar forms inside a previous bar, also known as a Mother Bar. Learn more about ST Inside Bars today!
SpeedyAlert is a free tool that sends you an email notification if a running application crashed, stalled or is short on RAM & other critical resources. This is a very useful tool for PC’s hosting 24/7 automated strategies. Avoid these not so funny “surprises” & download SpeedyAlert today!
The HolyGrail Algo uses calculations of the Hull Exponential Moving Average to identify market direction. A long or short condition is printed on the chart showing the potential direction an instrument may move. HolyGrail mainly uses it for indices, but it works with any market and any timeframe.
The Quantum Dynamic Volatility indicator paints volatility as price action unfolds - no more guesswork, no more nasty shocks. Watch and wait, then trade with this safety-first indicator!
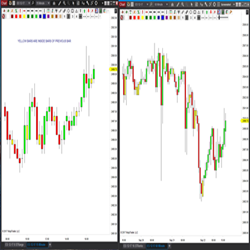
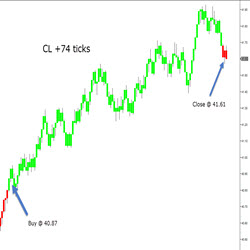
Fully-automated. The VMX selects a time of day to trade during the cash session for stock index futures. This system takes advantage of the volatility created by big institutions moving asset allocations in the equity markets. All positions closed before the end of the cash session.
The ribbon-like indicator, Fantastic MA Ribbon, is created by plotting multiple moving averages (MA) with varying lengths. It incorporates four signal mechanisms, offering diverse options to align with your unique trading style.
A unique course with a specific, rule-based & mechanical/objective trading methodology. Designed to help traders identify entries & exits, define size, manage risk and control emotions when trading Equity Markets with their own characteristics & terminology. Get FREE access to the patented AutoUFOs®
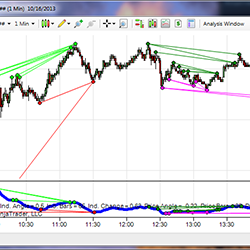
The Divergence Indicator for NinjaTrader utilizes a sophisticated algorithm to detect divergence, and eliminates some shortcomings of typical divergence indicators. It can be calculated using any indicator within NinjaTrader (ex. RSI, MACD, Stochastic, or any custom indicators).
TrendFinder identifies what direction the market is moving. TrendFinder is universal and works with any market and any time interval. When an upward bias is detected, the bars are displayed in Green. When a downward bias is detected, the bars are displayed in Red.
December 2, 2024
Mastering Sideways Markets With Auction Bars and Range Projections
November 19, 2024
Enhancing Your Automated Trading System: Key Insights from Best Pro Trade
November 14, 2024
NinjaTrader New Ecosystem Tools: October 2024 Edition
Enter Email for Updates