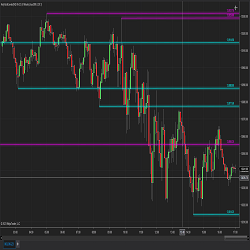
This algorithm calculates the support and resistance based on a look back period (number) of candles or bars and determines the support and resistance levels dynamically.
AMNTrader is a fully automated trading system. Trading is based on classical technical analysis with filtering such as volume, set of indicators and patterns. It is suitable for all futures and Forex trading instruments.
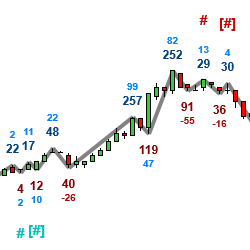
MBoxWave Algorithmic Buy / Sell Signals use Wyckoff concepts in analyzing waves, volume, delta volume, effort / result, etc... It allows you to easily scan charts for certain conditions to meet a criteria and then showing a signal that a potential trade setup has occurred.
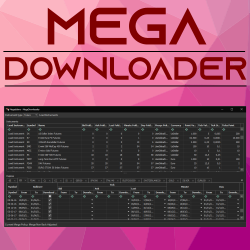
The MegaDownloader add-on allows you to download historical data asynchronously in a single window. Load instruments by type and view specifications and all available expiries for each instrument, including rollover period and date/time range for tick, minute, and day-based periods.
The Spread Trading Tool add on for NinjaTrader 8 allows for charting a variety of spread combinations from 2 leg 1:1 ratio spreads to more advanced butterfly spreads. A control panel connected to the strategy allows for easy entry and management of spread trades.
The Zero To Hero Trade Course aims to teach aspiring traders how to be consistent in their trading results. Students will learn about different approaches to trading, different styles, tricks and techniques used by the pros, as well as the psychological side of trading.
Share Service in NinjaTrader 8 is a secure file sharing platform specifically designed for the NinjaTrader 8 trading platform.
Anchored VWAP: A dynamic tool for trading strategies. Coding friendly: One of the standout features of the Anchored VWAP is its coding friendliness. Users can seamlessly integrate it into the code of any NinjaTrader strategy, allowing for easy implementation and customization.
Discover our daily trading and investment newsletter service provided by the #1 Market Timer of 2018 as ranked by Timer Digest.
The Wealth Builder’s Roadmap is a step-by-step process divided into distinct phases. The five Ps featured in The Wealth Builder's Roadmap cover each essential pillar needed for a rock-solid trading plan. The coaching program includes online training and one-on-one follow up sessions.
December 2, 2024
Mastering Sideways Markets With Auction Bars and Range Projections
November 19, 2024
Enhancing Your Automated Trading System: Key Insights from Best Pro Trade
November 14, 2024
NinjaTrader New Ecosystem Tools: October 2024 Edition
Enter Email for Updates