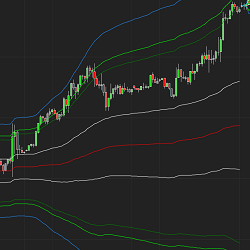
tcVwap is an indicator for monthly, weekly and daily VWAP calculation. VWAP is an indicator representing fair price of a financial instrument. This is the Volume Weighted Average Price. The VWAP mean price is often used by institutional traders as a reference.
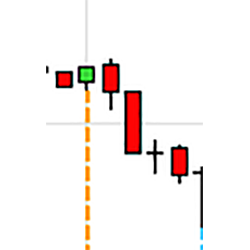
This tool and indicator helps you spot trigger entries with such features as one 4-range and one 14-range data series chart and one indicator. It's a simple, clean and very effective price-retrace system. Follow EdsRetracePlan to learn exactly when and where to buy or sell on price retraces.
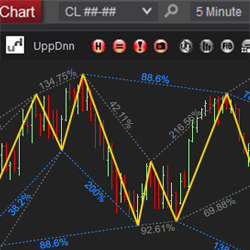
The Swing Toolkit is a collection of swing analysis tools designed to make trading faster and more consistent. Swing Pattern Trading utilizes the recognition of specific price patterns and the alignment of exact Fibonacci ratios to determine possible reversal points in the financial markets.
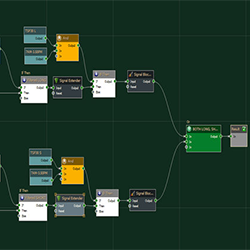
Custom strategy design in BloodHound. Remek! will program your trading strategy as per your specifications and requirements. Learn more!
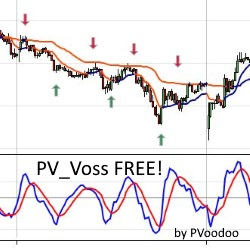
Try this FREE Voss Predictive Filter by John Ehlers & Henning U. Voss, with source code included by PVoodoo.com. Test it today for free!
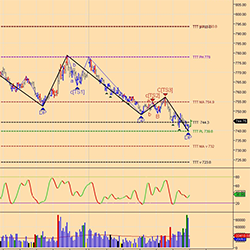
The TTT Lines Indicator extracts the information from the daily TTT E-Book report & plots the data directly on NinjaTrader charts. Quickly identify the TTT support and resistance levels plus more!
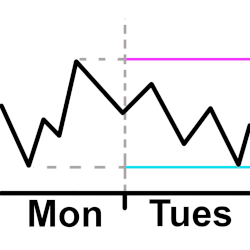
Plot a horizontal line for the high and low from the previous intraday. The user configures the open and close time they want to use for the intraday hours. This means the user can plot the high and low starting 30 minutes before the actual open and after the actual close if they want to.
These consulting services are tailored to meet the unique needs of trading companies, offering expert advice and innovative strategies to enhance performance and profitability. They provide in-depth market analysis, risk management solutions, and trading strategies designed to maximize your success.
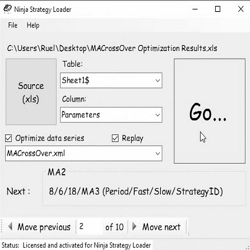
The Ninja Strategy loader allows traders to quickly and accurately load strategies into the NinjaTrader Strategy Tab or Chart Windows. Learn more!
Several studies have found a connection between full and new moons and stock market performance. Knowing how and when to time the cycles in trend shifts is centuries old, but new to most traders.
December 2, 2024
Mastering Sideways Markets With Auction Bars and Range Projections
November 19, 2024
Enhancing Your Automated Trading System: Key Insights from Best Pro Trade
November 14, 2024
NinjaTrader New Ecosystem Tools: October 2024 Edition
Enter Email for Updates