Daily Levels plots important levels such as prior days open/high/low/mid/close, overnight high/low/mid, IB high/low and more! It also displays historical probabilities of price touching each level in regular and overnight sessions for the most popular futures products.
ATS QQE is a powerful Quantitative Qualitative Estimation (QQE) indicator with additional options which make it more versatile.
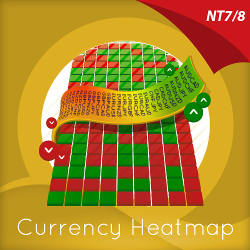
The Currency Heatmap displays the “hottest” and “coldest” areas of the forex landscape. Vertically, 28 currency pairs are listed and ranked from the most bullish to the most bearish. Horizontally, each cell then displays bullish and bearish sentiment across multiple timeframes instantly.
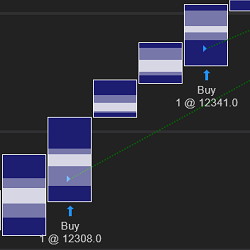
Easily build order flow strategies using bar point of control and value areas highs and lows. No complex coding required. Optimal Value Area is fully compatible with Strategy Builder.
The system looks for the highest high and lowest low over past bars, then the system tags the entry with a line that is proportional to your entry settings. Then the strategy calculates: Imbalance, velocity, momentum and probability.
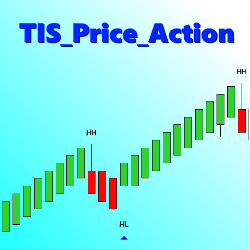
The TIS_Price_Action indicator detects and ranks pivots, then looks for a user specified sequence, such as Highest Low followed by Highest High to paint a long signal. Users can trigger 1 to 3 pivots to trigger a signal.
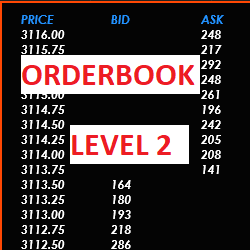
itcOrderBook is a Ninja Trader 8 indicator that displays the order book for the current asset (market depth or level 2). Ask & Bid are displayed on the price ladder and colors & text size can be customized at will. Users can set the location X,Y where the box will display.
Three unique day trading programs available! Start out with a bundle of indicators or get serious with your trading right away and start with a full suite of indicators, full training course and mentoring in the “Pro Trader” program. Compare courses to see which is best for you!
The TrendLord indicator is a chart overlay indicator that can be used as a confirmation indicator. It is a derivative of a smoothed moving average but with the advantage of representing it as a colored change histogram. Click to learn more.
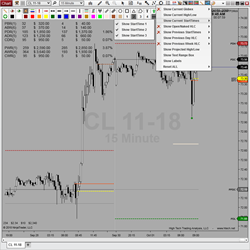
Price Times Plus plots 24 current, previous & projected OHLCR levels of significance! It features both daily & weekly levels, projected ranges, 3 user defined start times, unique summary information, a toolbar icon for easy configuration, and is Market Analyzer, Strategy Builder & Bloodhound ready!
December 2, 2024
Mastering Sideways Markets With Auction Bars and Range Projections
November 19, 2024
Enhancing Your Automated Trading System: Key Insights from Best Pro Trade
November 14, 2024
NinjaTrader New Ecosystem Tools: October 2024 Edition
Enter Email for Updates