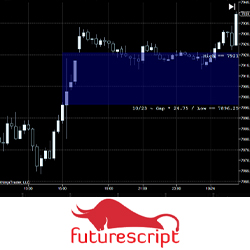
The Gap indicator was designed to illustrate when dramatic price disconnects from one period to the next when the market establishes critical levels. This indicator has been carefully constructed to explore different perspectives and trading approaches related to the gap in intuitive ways.
Automatically snap trade execution screenshots or take a snap at a set bar interval. SnapMyTrade assists traders with journaling and post trade analysis.
OTS Trading Strategies - Drawing from over 30 years of trading experience, OTS is delighted to offer exclusive insights into proprietary trading strategies.
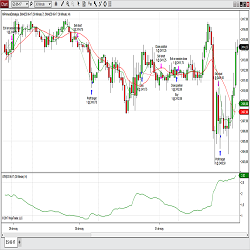
Automated trading for the S&P 500, Indices, ETFs, Stocks and Cryptocurrencies. Discretionary trading indicators. The RD3 uses a two stage system for identifying profitable swing trading opportunities.
The Quantum Dynamic Volatility indicator paints volatility as price action unfolds - no more guesswork, no more nasty shocks. Watch and wait, then trade with this safety-first indicator!
Expert Trading Programmers specializes in NinjaTrader indicators, strategies, add-ons, bar types, chart styles, drawing tools, performance metrics, and much more! Their products work on Futures, Forex and/or Stock markets. Get a free quote on your programming project now!
Let us help you automate your indicator or strategy! Our custom programming service provides automation for indicators and automated strategies.
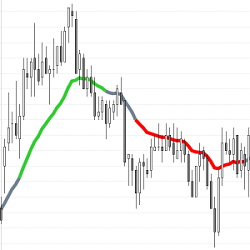
This indicator uses recent bar closes to calculate the “Always In” direction to help traders determine market trends. Use the Simple Always In EMA as a discretionary indicator or for automated trading. It is FREE to download and use!
Trend lines, swing pivots, and price patterns are simple price action trading tools that seasoned traders use daily. Day Trading With Price Action, by Galen Woods, is a high-quality trading course that teaches how to effectively trade via price action analysis. Download a free chapter today!
ZoneVue Pro, an advanced Supply & Demand Indicator, giving you the edge you've been looking for! Identify quality zones from price action to order flow, identifying pending orders from banks and intuitions. No lagging indicators. Trade like a sniper. Transform your trading!
December 2, 2024
Mastering Sideways Markets With Auction Bars and Range Projections
November 19, 2024
Enhancing Your Automated Trading System: Key Insights from Best Pro Trade
November 14, 2024
NinjaTrader New Ecosystem Tools: October 2024 Edition
Enter Email for Updates