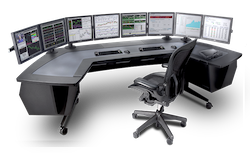
Immerse yourself in a dynamic trading environment with AmerTd's On-Site & Virtual Trading Rooms. Equipped with the latest technology and real-time market data, this state-of-the-art facility offers a collaborative space for traders to execute strategies and maximize their potential.
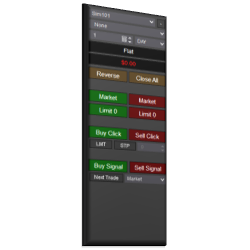
The Signal Entry Orders indicator allows traders to click a button that initiates logic to submit orders immediately on the close of a bar, as soon as a signal occurs. This removes unnecessary stress and challenge on entering orders.
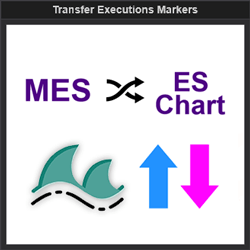
This indicator allows the user to obtain execution data from one instrument and overlay it on another. This increases application functionality and charting efficiency.
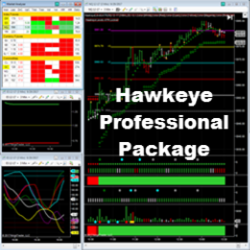
The Hawkeye Professional Package includes all Hawkeye tools for volume spread analysis, on multiple time-frames across all markets. These powerful indicators tell traders when a trend is commencing, in congestion and where to find the correct exit. Buy Now using code: “NT10Off” for a 10% discount.
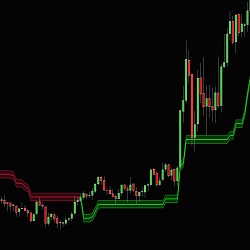
Introducing Friend Zone, a professional market indicator designed to identify mean reversion opportunities with precision. By analyzing price movements and historical data, Friend Zone intelligently detects when a security has deviated significantly from its average value.
Custom program your own indicators / strategies / add-ons / tools for NT8. We custom program fully or semi-automated strategies, indicators, add-ons and tools based on your requirements. All source code delivered with additional free tech support after delivery. Get a free, no-obligation quote now!
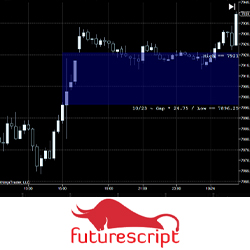
The Gap indicator was designed to illustrate when dramatic price disconnects from one period to the next when the market establishes critical levels. This indicator has been carefully constructed to explore different perspectives and trading approaches related to the gap in intuitive ways.
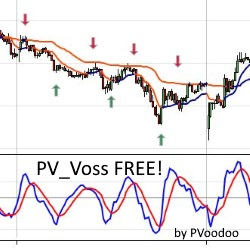
Try this FREE Voss Predictive Filter by John Ehlers & Henning U. Voss, with source code included by PVoodoo.com. Test it today for free!
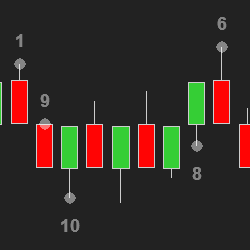
Unfinished auctions act like magnets for price. The stronger the imbalance, the stronger the pull. Optimal Unfinished Auction plots these levels and imbalances automatically on your chart. Bring order flow to your trading without over-complication! Strategy Builder compatible.
Discover our daily trading and investment newsletter service provided by the #1 Market Timer of 2018 as ranked by Timer Digest.
December 2, 2024
Mastering Sideways Markets With Auction Bars and Range Projections
November 19, 2024
Enhancing Your Automated Trading System: Key Insights from Best Pro Trade
November 14, 2024
NinjaTrader New Ecosystem Tools: October 2024 Edition
Enter Email for Updates