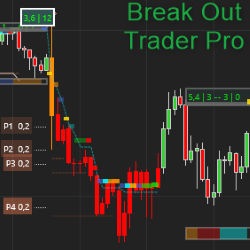
Accumulation or Distribution, Consolidations and Break-Outs. This indicator finds consolidation phases and signals great trade set-ups when the market breaks out from these ranges. It determines profit targets and stop loss levels. It also calculates the "heat" and has many other great features.
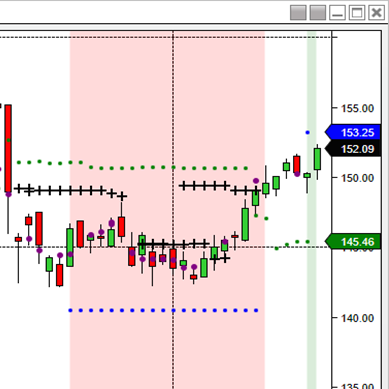
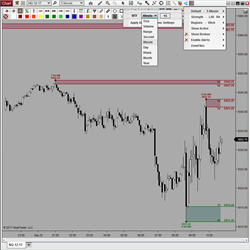
The iMTF® Ichimoku indicator features multi time frame support/resistance levels using crosses (long term) and purple dots (short term). Cloud breakouts are represented by green and red shaded areas to identify buy and short sale zones after an instrument has broken out of the cloud.
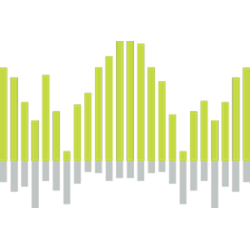
The LogikTickX utilizes signal processing and price reconstruction techniques to cut through the noise, reconstructing the true transaction, minimizing the hiding of large orders. This allows traders to identify and react to the market sentiment, and correlation between price and volume development.
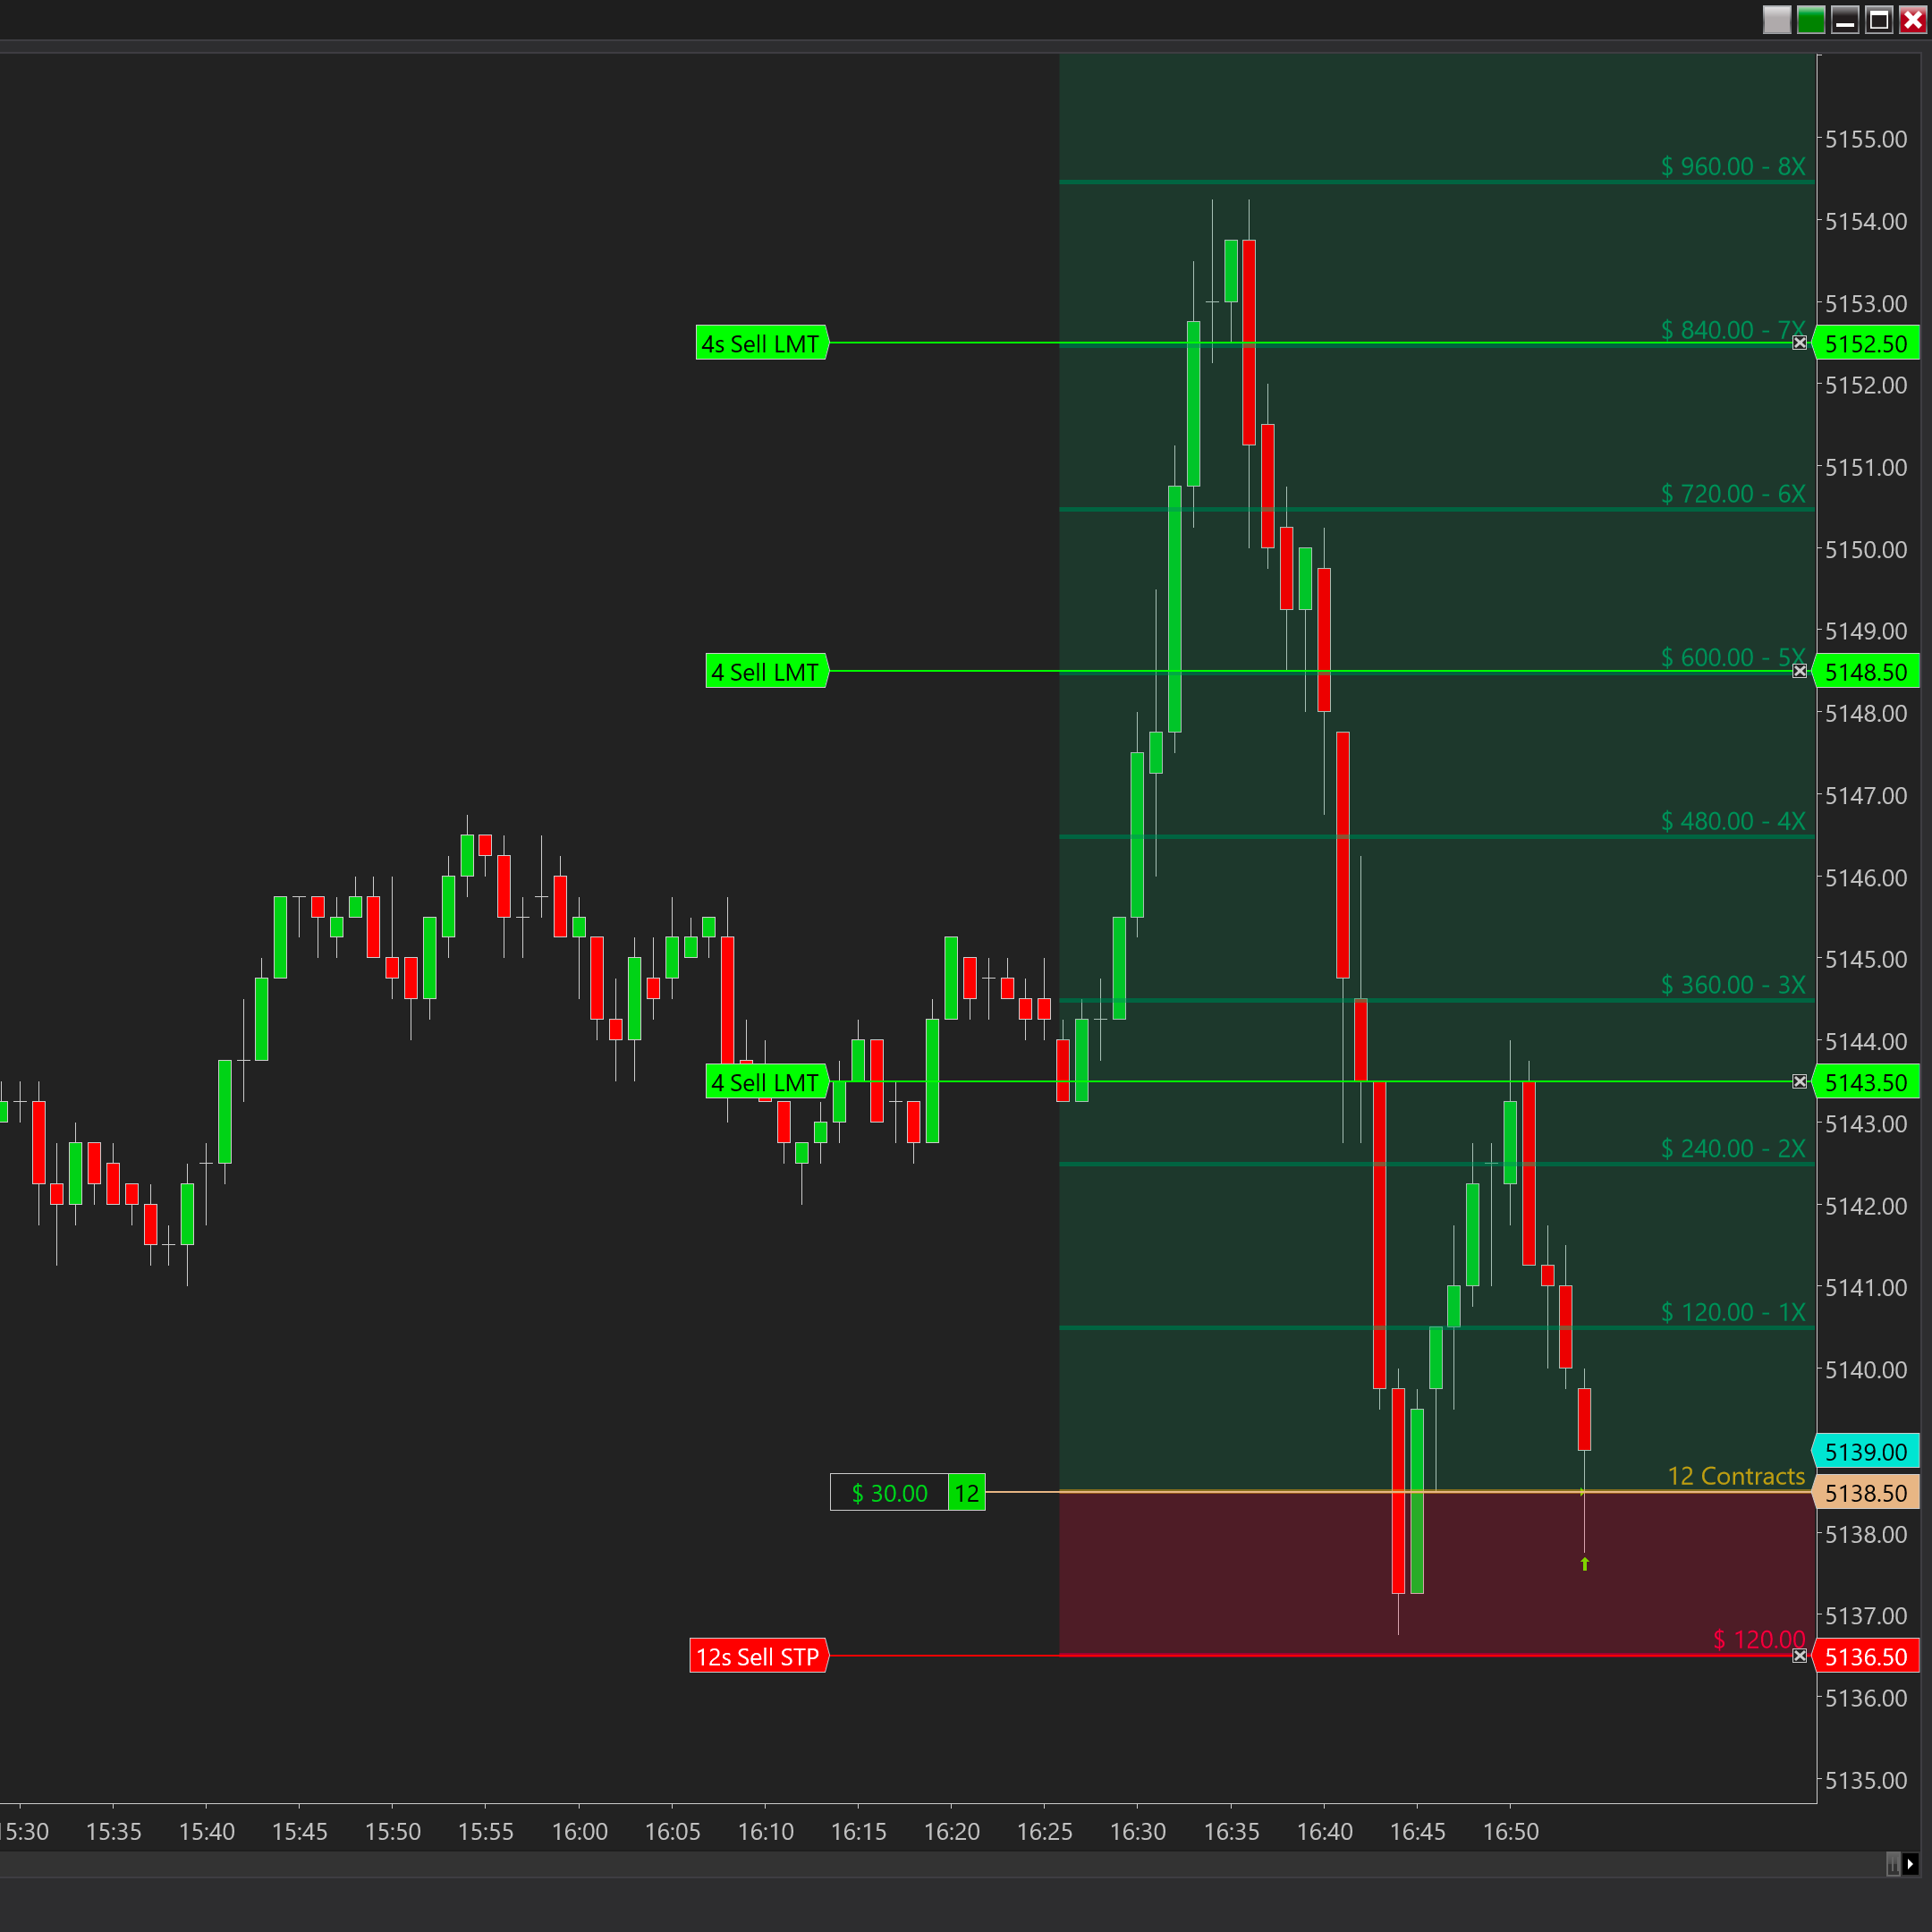
NTRR Risk Reward is a must have add-on that offers full customization, automatically calculates contracts needed based on currency risk amount, auto updates your ChartTrader quantity and your "ATM Strategy" in an instant and allowing you to use one-click entry trading based on the drawn direction.
The Flow of fund(FOF) divergence signal indicator consists of the following parts: The Flow of fund histogram, FOF trend line, back test result in sub chart and divergence signal in main chart. The signal is instantly drawn on current bar and will not repaint.
Learn from a certified Mental Performance Coach and Veteran Trader! Discover how to control that voice inside of you that causes you to chase trades, enter too early, revenge trade, fear of missing out (FOMO), over trade, under trade, and blow accounts. And the list goes on...
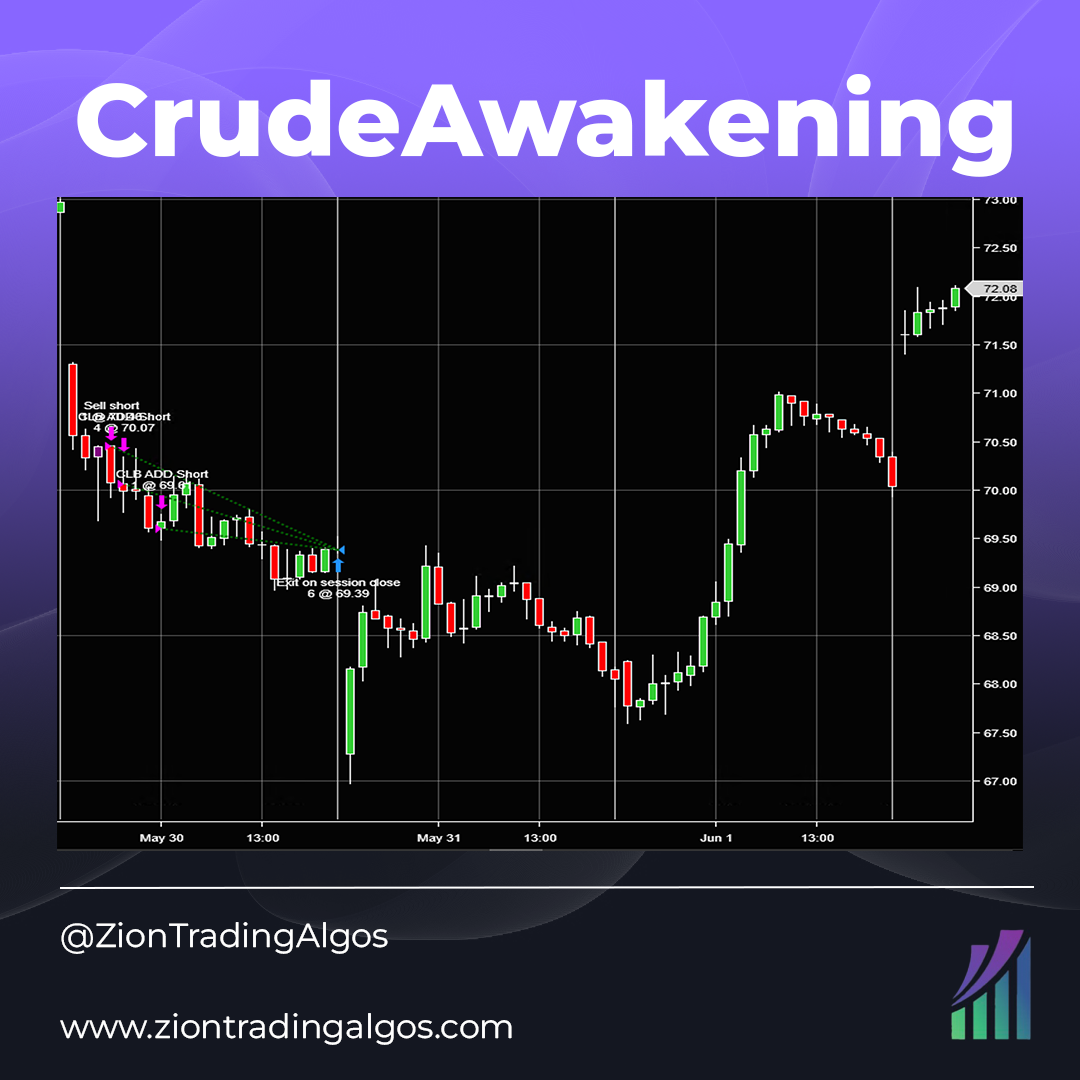
CrudeAwakening is an intraday CL system that trades on the 15-minute chart. It is a short only strategy.
The algorithm allows for fully automatic trading or semi-automatic. It works in Micro or Micro futures markets. For the algorithm to manage the trades, you can set a stop-loss and target from the configuration menu. If you want, you can also choose NinjaTrader’s ATM Strategy.
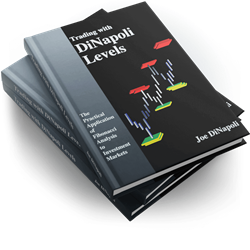
The experts say, "The Trend is your friend." DiNapoli Levels teaches you how to define ''Trend'.' The experts say, "Buy strength and sell weakness." This book teaches you how to buy weakness in an uptrend and sell strength in a downtrend, and of course, where exactly to take your profits.
Supply & Demand MTF automatically displays areas of support and resistance. It features 8 unique Zone Types with abilities to show, hide, add, remove, modify, merge, save or load templates with a single click via a unique right click context menu or toolbar icon. Strategy Builder & Bloodhound Ready!
December 2, 2024
Mastering Sideways Markets With Auction Bars and Range Projections
November 19, 2024
Enhancing Your Automated Trading System: Key Insights from Best Pro Trade
November 14, 2024
NinjaTrader New Ecosystem Tools: October 2024 Edition
Enter Email for Updates