Price action in relation to volume. Studying these variables establishes the equilibrium of supply and demand, as well as the possible near-term direction of the market. Don't just measure volume - measure volume that can anticipate a potential change in trader sentiment!
SpeculatorSeth's elite indicators use order flow and level 2 to give day traders and scalpers greater insight into current market conditions and market maker positioning. Includes spread charts to follow the yield curve and a synthetic dollar index.
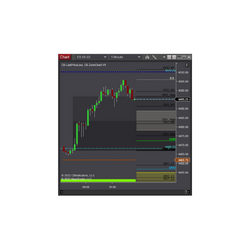
CB ZoneChart V4 is a longer-term day trade indicator that shows support and resistance, fibs and opening range areas. It has many settings and has been updated over the years (since 2016). Combining it with the other CB Indicators makes a great combo. Try it out with a 14-day free trial!
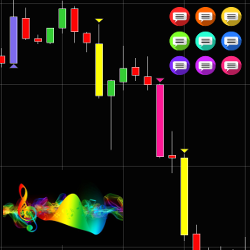
Highly customizable indicator allowing traders to track volatility without spending time staring at a screen. Candlesticks are represented by different custom colors depending on the direction of price movement & its amplitude. Notifications are also sent via email, text or by your favorite sound.
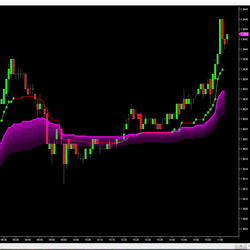
PriceIsKing.com's Futures RAM Indicator is based on a powerful moving average pattern recognition algorithm developed with years of research and testing. Get started with a free 2-week trial today!
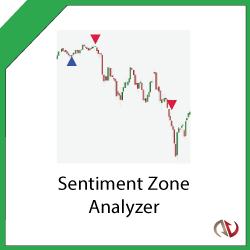
Use the Sentiment Zone Analyzer to measure overall market sentiment to spot trend reversals early! Based on the premise that extremely bullish or bearish tendencies will eventually lead to trend reversals. Dynamically calculates overbought and oversold levels based on previous price action.
DTB River is an implementation of DTB Waves on non-time based charts and the results are plotted on time-based charts. It provides an added layer of noise filtering for waves. During the consolidation phase DTB River flattens out.
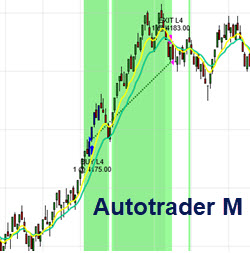
The AuToTrader M is an automated system for highly active traders willing to conservatively trade high-volatility future instrument (CL, ES, YM, etc.)The system comes w/ BACKGROUND M to track positions, a powerful money management module to protect profit & principal.Lease includes training, support
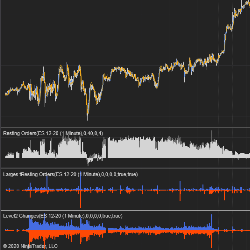
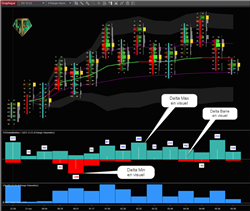
This indicator will visually tell you the evolution of this OrderFlow data: Delta / Delta Min / Delta Max. Ideal for detecting Delta divergences. No need to read the NinjaTrader statistics table anymore! Please note, you must have the NT8 version allowing access to OrderFlow.
Includes volume profile and TPO market profile, presets for one-click charting, daily, weekly, monthly, date, composite, and drawn profiles. Offers defined or continuous session types and load optimization. All of these features make it one of the most advanced profiles available on the market.
December 2, 2024
Mastering Sideways Markets With Auction Bars and Range Projections
November 19, 2024
Enhancing Your Automated Trading System: Key Insights from Best Pro Trade
November 14, 2024
NinjaTrader New Ecosystem Tools: October 2024 Edition
Enter Email for Updates