CommoditySignal is an essential trading signal app for commodity traders, offering precise signals for Crude Oil, Natural Gas, Gold, and Silver. Experience a 3-day free trial to see its effectiveness firsthand. Available on both iOS and Android, CommoditySignal delivers timely insights.
Get Integrated Basic and Advanced Training in a full-year trader development program. This program includes access to live online Basic and Advanced Training events in addition to on-demand learning modules. Designed for those who can commit to 1-3 hours of trader development per day.
This is a trend following trading system trading simultaneously on three configurable and back testable time frames. It is aimed to be used as a CTA, trend following, multi assets trading system where the tradable assets universe is composed by futures on indices, commodities and foreign exchanges.
Semi-auto trading tool used to help enter and manage trades when using Renko style charts. Customize entry condition, stops, targets, breakeven and trail.
Do you want to overcome the challenges that often leave traders feeling overwhelmed and uncertain? Introduction to the Trader Brain will give you the practical knowledge to solve your money-losing patterns.
Don't miss any more targets by a few ticks with Target Zone!
This chart analysis package helps you move forward quickly, detecting opportunities and enhancing trading decisions. Trade with greater confidence and consistency. Quick-to-learn, rules-based strategy. Email alerts so you don’t miss an opportunity. Management tools help entering or exiting a trade.
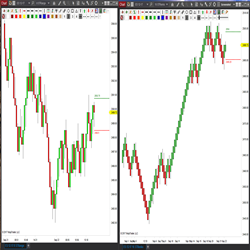
STBars are Structural Trading’s custom range and renko bars which include the STRangemanker, a tool identifying for support, resistance and trend bias. The STBars are available in NinjaTrader 7 and NinjaTrader 8. Learn more!
Advanced Wyckoff Course: Learn advanced concepts of the Wyckoff Method in a simple way. This will teach you unique concepts that will make you an expert in the Wyckoff methodology and take your analysis and trading to the next level.
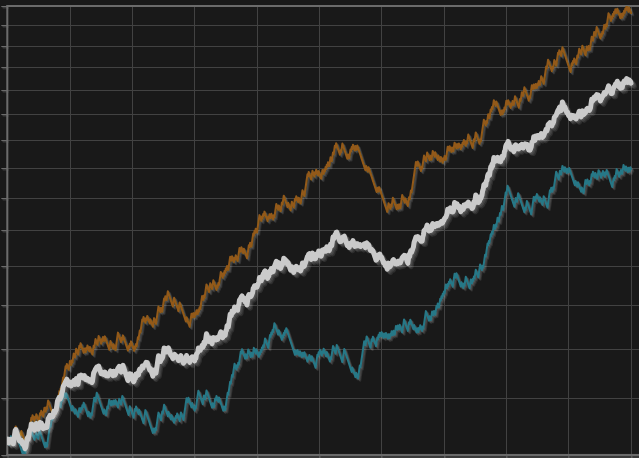
This is a fully automated trading robot that is consistent year over year. It automatically sets position sizing and trailing targets based on market volatility & automatically sends an email when it enters a trade. You can customize present variables that can be changed based on individual needs.
December 2, 2024
Mastering Sideways Markets With Auction Bars and Range Projections
November 19, 2024
Enhancing Your Automated Trading System: Key Insights from Best Pro Trade
November 14, 2024
NinjaTrader New Ecosystem Tools: October 2024 Edition
Enter Email for Updates