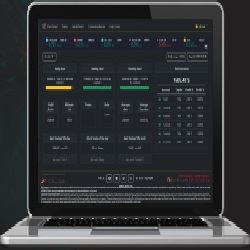
The best risk management dashboard tool, with an intuitive web platform that provides complete control, protection & detailed visualization of the evolution of all trading accounts. Optimized for propfirm trading, our solution is the ultimate choice for traders and teams. Click to learn more!
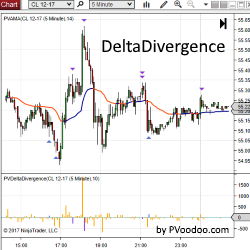
PVDeltaDivergence Indicator is a powerful tool designed to help traders identify possible turning points in their favorite markets with order flow analysis. Get a free trial of PVDeltaDivergence for NinjaTrader today!
The VWAP Predator uses VWAP as a zonal guide with Bull and Bear Bands. It then uses logic to recognize accumulation and distribution candles. If those candles cross from a zone to another, then a Signal Candle is produced. Buy Signals in the Bullish Bands and Sell Signals only in the Bearish Bands.
CryptoSignal is a must-have trading signal app for cryptocurrency traders, offering accurate signals for Bitcoin, Ethereum, Dogecoin, Solana, Cardano, and more. Enjoy a 3-day free trial to test its precision. Available on both iOS and Android, CryptoSignal provides timely insights.
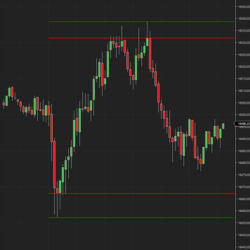
Elevate your trading strategy with the DR/iDR Indicator for NinjaTrader: Your essential tool for identifying key price levels. This advanced indicator displays both the Daily Range and the Implied Daily Range directly on your trading charts, providing crucial insights.
Swing MNTrader is a fully automated trading system. Trading is based on a moving average strategy with a filter system based on the stochastic RSI indicator. An improved position support system with flexible settings to improve trading consistency. Suitable for all Forex trading instruments.
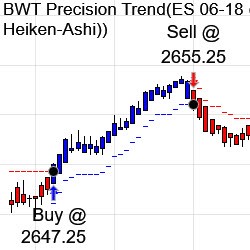
The BWT Precision Indicators originated in 2004. The BWT Precision Trend Indicator provides well placed potential trade signals and never misses a major move on your charts. Other BWT Indicators provide decision support using volume and price action.
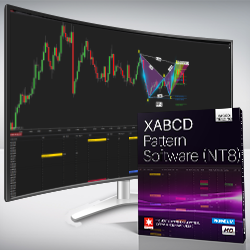
Saving you time is really import to us which is why the XABCD Pattern Suite will scan, find and alert you to XABCD patterns in any market and any timeframe. Once found, the pattern is automatically drawn onto the chart to make things easier. This includes everything you need to learn patterns.
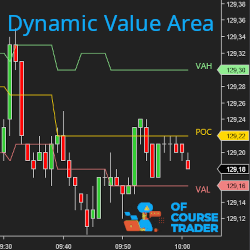
The Dynamic Value Area allows you to visualize in real time the evolution of the POC, VAL, VAH levels corresponding to the most traded value area. It also gives you historical levels. Its NinjaScript API will allow you to integrate the value area into your own indicators and strategies.
YMI University is designed to pack the utmost essential content into one trading course. It's designed to give you a new level of understanding of how the stock market works, how to get started, and how you can utilize your abilities to excel and grow.
December 2, 2024
Mastering Sideways Markets With Auction Bars and Range Projections
November 19, 2024
Enhancing Your Automated Trading System: Key Insights from Best Pro Trade
November 14, 2024
NinjaTrader New Ecosystem Tools: October 2024 Edition
Enter Email for Updates