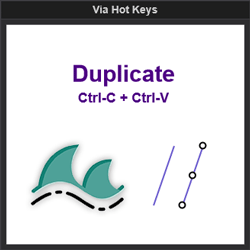
This indicator allows the user to copy-paste in one button, increasing application functionality and user charting efficiency.
Ultimate Support and Resistance Suite provides precise support and resistance lines and zones to trade any market on any time-frame. This tool enables you to accurately determine which supply and demand price levels require your attention. Use it as a standalone indicator or enhance any system.
Strong momentum cannot be maintained! Traders will always exit their position at a certain level, which causes price to pullback or retrace. Measuring strong momentum can help the trader to anticipate the eventual exhaustion. An award winning "heads-up display" indicator from The Intentional Trader!
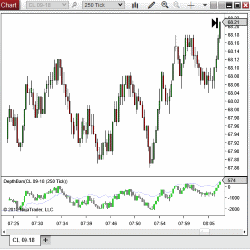
The Depth Bars & Pull-stack indicators by PureAlgo Capital detect changes in the total bid depth and total ask depth, providing a better idea of whether the bulls or bears are in control of the market & which players are about to fold.
TradeFoxx is an automated trading software designed for the NinjaTrader Desktop platform, version 8. It supports trading in Forex, Futures, and Equities, and offers full automation with time frame control. A free 30-day trial is available, allowing you to test the product before making a purchase.
Upgrade to the silver plan for enhanced trading capabilities. Get all the features of the bronze plan plus the reference synchronizer module. The reference synchronizer indicator ensures seamless data flow between different charts, including market profile, daily, weekly and monthly charts.
Unlock the secrets of successful trading with the latest version of the Order Flow Trading Setups eBook. Dive into over 12 unique order flow setups, each detailed with examples and entry points. This guide offers practical setups used in daily trading and clear screenshots for each pattern.
No need to stare at the chart and wonder or make guesses - the Raptor will tell you! The Raptor detects potential trades for you out of the box and will alert you when these trades are setting up. This gives you plenty of time to get into the market with zero stress.
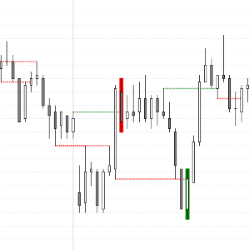
This indicator shows Breakout Tests or Breakout Pullbacks of broken support and resistance in real-time. As a beta feature you can also test Failed Breakouts. Use the Breakout Test indicator as a discretionary indicator in your day trading. Get started with a free 2-week trial today!
Indicator package + Scalping strategy for NinjaTrader 8.
December 2, 2024
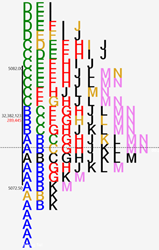
Mastering Sideways Markets With Auction Bars and Range Projections
November 19, 2024
Enhancing Your Automated Trading System: Key Insights from Best Pro Trade
November 14, 2024
NinjaTrader New Ecosystem Tools: October 2024 Edition
Enter Email for Updates


 from Indicator Warehouse.png)