Advanced Wyckoff Course: Learn advanced concepts of the Wyckoff Method in a simple way. This will teach you unique concepts that will make you an expert in the Wyckoff methodology and take your analysis and trading to the next level.
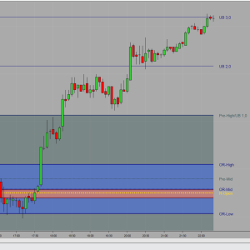
The Opening Range is the range obtained from the highest and lowest price of a security during the first minutes of daily trading activity. For example, an opening range can be calculated for the first 5, 15 or 30 minutes. This Opening Range is a multi-timeframe (MTF) indicator .
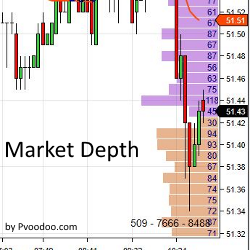
The addition of Market Depth indicators allow traders to see the bid/ask data based on price in real time. Similar to the Level II data featured in the NinjaTrader SuperDOM, the Market Depth Indicator plots bid/ask data directly on a chart. Learn more!
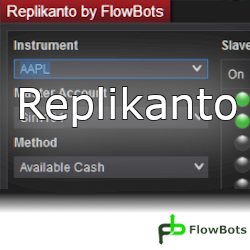
This is an order replication add-on between accounts. It replicates orders from a Leader Account to multiple follower accounts according to the replication method selected. There are several replication methods, each with its own functionality. It replicates orders in both NinjaTrader 7 & 8.
Pattern MNTrader is a fully automated trading system. Trading is conducted based on trading patterns, support and resistance lines, Fibonacci lines and trend lines. This unique combination of tools creates an innovative system of support positions with flexible settings.
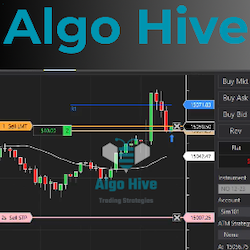
BurstAlgo is a straightforward and efficient automated trading tool designed to trade prop-firm accounts. It's built to preform up to three trades daily, focusing on consistent trading. This algorithm is all about keeping things practical.
Daily Levels plots important levels such as prior days open/high/low/mid/close, overnight high/low/mid, IB high/low and more! It also displays historical probabilities of price touching each level in regular and overnight sessions for the most popular futures products.
With the book High Probable Japanese Candlestick Patterns, learn how to utilize trading patterns which help give you an edge in the markets. Available in both Kindle and paperback versions with full color charts & trading examples, this book is for traders of futures, forex, stocks and options.
If you're serious about learning to trade forex, this is the program for you. It includes all the knowledge and tools you need to succeed as a forex trader, and all taught in live markets with two seasoned traders. So grab your seat now, and start trading with confidence.
Tradesyncer is a powerful trading solution that synchronizes all your futures (prop firm) trading accounts across multiple brokers, platforms, and data feeds. This dashboard lets you monitor and manage your trade data, ensuring efficiency and insights from one centralized location.
December 2, 2024
Mastering Sideways Markets With Auction Bars and Range Projections
November 19, 2024
Enhancing Your Automated Trading System: Key Insights from Best Pro Trade
November 14, 2024
NinjaTrader New Ecosystem Tools: October 2024 Edition
Enter Email for Updates