TradingCoders offers conversion services between NinjaTrader 7, NinjaTrader 8, MetaTrader4, MultiCharts.NET and eSignal (among others). Have your NinjaTrader indicators or strategies converted from NinjaTrader 7 to version 8, or move your formulas to NinjaTrader from another platform!
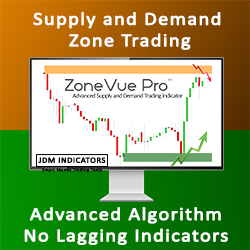
ZoneVue Pro, an advanced Supply & Demand Indicator, giving you the edge you've been looking for! Identify quality zones from price action to order flow, identifying pending orders from banks and intuitions. No lagging indicators. Trade like a sniper. Transform your trading!
The Exhaustion Absorption Detector, which is based on live time and sales data, is designed to display order activity between the bid and offers at market price.
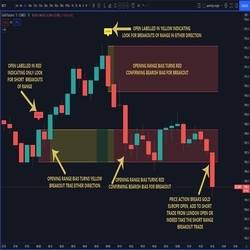
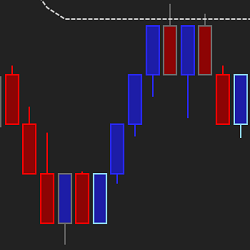
Defines the opening ranges of major markets, gold and oil pit opens, and major data points. The range has a cloud which automatically changes color depending on the market bias and continues until the open the next day. This allows for multiple entries of breakouts throughout the following 24 hours.
A powerful self-study program that will help you learn the core principles and implementation of the Hunt Volatility Funnel Method with a total of 18 hours of material, topic by topic, alongside case studies and live trading webinars.
Use the experience of a quantitative trading system professional to help design, test, improve or optimize your trading strategy. Get a complete system analysis to have the confidence that your strategy performs exactly how it was designed to.
This incredibly innovative suite of Bollinger Bands and divergence indicators shows selected, plotted ‘dots’ with a broad selection of Bollinger Band combinations. You can choose from seven indicator combinations!
NinjaScript development covering the full range of capabilities in NinjaTrader 7 & NinjaTrader 8. QTradez develops custom indicators, strategies, bar types, SuperDOM columns and more to enhance Add On functionality. Fixed pricing is available for well-defined projects! Get in Touch Today!
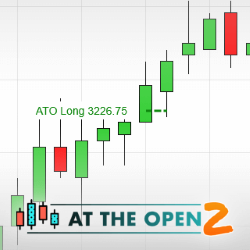
Use the ATO 2 indicator and learn how to take advantage of big price action moves right after the market opens. This is our flagship day trading method which we have improved over the years. Come see what put us on the map. Package includes both video and live training.
Track volume profile in three timescales easily! Optimal Vision analyses point of control and value area breakouts in three rolling lookback periods of your choice and color-codes your bars by strength of signal. A simple way to bring dynamic volume profile to your trading! Strategy compatible.
December 2, 2024
Mastering Sideways Markets With Auction Bars and Range Projections
November 19, 2024
Enhancing Your Automated Trading System: Key Insights from Best Pro Trade
November 14, 2024
NinjaTrader New Ecosystem Tools: October 2024 Edition
Enter Email for Updates