This trading masterclass delivers all the fundamental knowledge and trading skills as the foundations on which to develop your trading career for financial, commodity and digital asset classes. Up to one year to complete. Includes a free trading challenge to qualify for a funded trading account.
Created to help aid momentum-style charting in finding support and resistance lines. It was specifically made for the ES when plotted with tick bars. This tool may help cut down on chart preparation time or get your chart caught back up if busy multi-tasking.
DataGrabber™ grabs price and volume data for any futures instrument. It is designed to work with the AI prediction software, AITrendPredictor™. DataGrabber™ data files get fed into AITrendPredictor™ to train the AI model to find patterns on price, volume, day and time to make a price prediction.
Side-Bias Indicators include intelligent moving averages and a trailing stop indicator for NinjaTrader. Included are 3 proprietary calculations that track price very accurately yet smoothly, offering stunning support and resistance levels. They pick a side to stick to price while avoiding whipsaws.
Elevate your trading to new heights with the platinum plan package. This comprehensive package includes all 9 NinjaTrader indicator modules and 13 NinjaTrader Drawing Tool modules from the gold plan, providing a solid foundation for market analysis and charting.
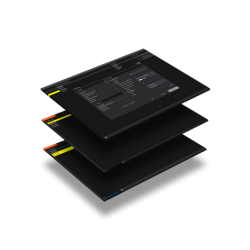
Market Analyzer Column: Effortlessly tailor real-time market data to your needs.
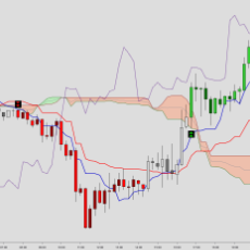
The Ichimoku Kinko Hyo, also known as the Ichimoku Cloud, is a versatile indicator that defines support / resistance, trend direction, momentum and trade signals. One can also think of this indicator displaying momentum in 5 separate time-frames.
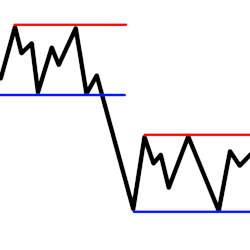
This study guide covers most of chart patterns of the price action. The study will cover trendline strategies, candlesticks patterns, chart patterns, Elliot Wave Theory, harmonic patterns, risk management, trading plan and trading psychology.
Trade your own capital with consistency. Follow your own plan from day one. Develop and demonstrate your trading skills. Pass qualification to get a Master Account. Show results and get your first $10k withdrawal commission-free. Invest in yourself. It's time to catch a wave!
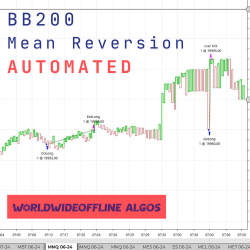
The original BB200 mean reversion strategy is designed for NQ/MNQ, on their specific Kagi set charts. BB200 can be deployed on any pair of your choice, not just NQ/MNQ. Backtesting is suggested before use. They like to run the strategy on ES/MES, as well. BB200 utilizes a trend filter.
December 2, 2024
Mastering Sideways Markets With Auction Bars and Range Projections
November 19, 2024
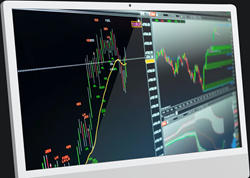
Enhancing Your Automated Trading System: Key Insights from Best Pro Trade
November 14, 2024
NinjaTrader New Ecosystem Tools: October 2024 Edition
Enter Email for Updates