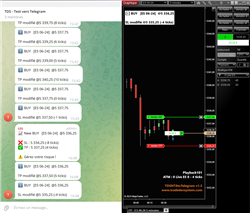
This indicator will be responsible for sending on your telegram channel your positions taken using ATM.
DiNapoli Levels are a combination of leading and lagging indicators providing predefined entry levels, reasonably tight stops, and precalculated profit targets. This package includes the Auto Fibonacci Retracement tool, proprietary Oscillator Predictor and all new MACD Predictor with video demos.
3 indicators in 1! The C-Dash is a customizable, check-list style dashboard that comes with The Chompsky Bands Pro and Chompsky Fibs. Includes current ATR Current BPMs (bars per minute), an algorithmically weighted color wheel (weighting is customizable), and more.
FXAN delivers a full approach that combines institutional tools, education, and professional support to help you trade with confidence. Their algorithms and training program have been developed by trading experts who’ve dominated markets for years.
To receive their free Weekly Market Movers trading schedule, just enter your email in the "" Get Free Training Video "" box. See how they schedule their trades each week as they will email you their free weekly trading schedule.
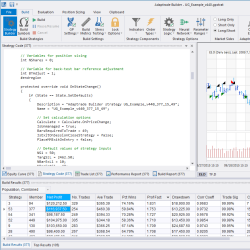
Developing automated trading strategies can be time consuming and difficult. Adaptrade Builder is an advanced trading strategy generator that will quickly find, code and test unique and complete trading strategies based on your requirements. Start building strategies today with a free 30-day trial!
Chompsky Bands: Single and second entry reversal signals and momentum signals, including MACD V5 signals. Includes min/max Bars Per Minute (BPM) filter, Trend Resilience, EMA Tick Separation Filter, Wave Counter. Signal outputs and customizable tags.
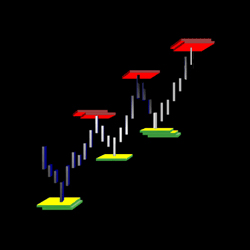
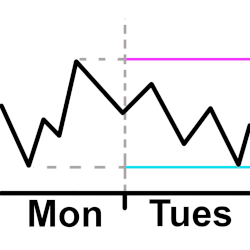
Plot a horizontal line for the high and low from the previous intraday. The user configures the open and close time they want to use for the intraday hours. This means the user can plot the high and low starting 30 minutes before the actual open and after the actual close if they want to.
QuantCycles harnesses artificial intelligence (AI) and machine learning (ML) for superior predictability, stability and chart analysis. With refined algorithms using advanced Fourier cycle analysis, Hurst cycles and W.D. Gann theories, this latest version delivers exceptionally accurate forecasting.
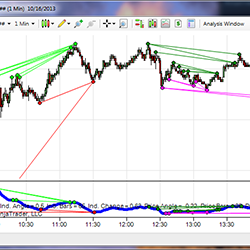
The Divergence Indicator for NinjaTrader utilizes a sophisticated algorithm to detect divergence, and eliminates some shortcomings of typical divergence indicators. It can be calculated using any indicator within NinjaTrader (ex. RSI, MACD, Stochastic, or any custom indicators).
December 2, 2024
Mastering Sideways Markets With Auction Bars and Range Projections
November 19, 2024
Enhancing Your Automated Trading System: Key Insights from Best Pro Trade
November 14, 2024
NinjaTrader New Ecosystem Tools: October 2024 Edition
Enter Email for Updates