Their European open LTR targets the Nasdaq, S&P 500 and FDAX. They cater for new to expert traders. They combine a highly successful 5-minute chart trading technique with 15 & 60 minutes charts.
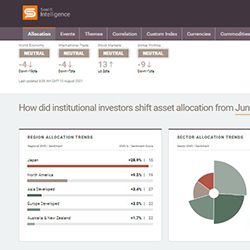
Sentifi detects market-moving events reported for stocks & currencies across Twitter, news & blogs. Sentifi is the largest licensed ingester of these data sets, mining them for actionable investment insights. Analytics include allocation shifts by professional investors in response to macro events.
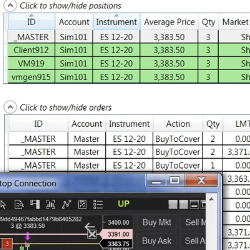
The indicator allows you to quickly open, close, submit, change, and cancel orders with ease. Its standout feature is the specially designed ladder columns, which provide a clear visualization of market behavior through detailed order flow information.
Replicate orders and manage positions from a master NinjaTrader instance to one or multiple NinjaTrader slaves.
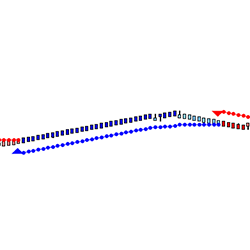
The system features two parallel cloud bands that enhance trend analysis. It provides two types of pullback signals: Fibonacci and price action, to expand trading opportunities. Additionally, the trailing stop plot, driven by price action, ensures timely exits during sudden market fluctuations.
You can now calculate your recommended trade position size for stocks based on the current market volatility and your risk appetite, in real time. Once you input the “RiskPerTrade” amount, It displays the number of shares in your market analyzer column. Get this powerful risk management tool!
Elevated trading with precision and autonomy. Trade smarter, hands-free! Does not activate everyday as it is looking for specific market opportunities.
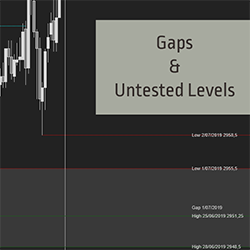
The Gaps & Untested Levels indicator tracks price gaps based on the prior session range or the prior session close. It can also track untested high of session, low of session, and open & close. Notice weak highs/lows immediately and be prepared for every gap fill trade. Start your 2-week trial now!
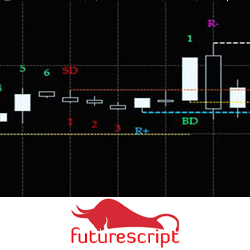
The Cycle Trend was developed as a way to evaluate trends with as little lag as possible compared to more conventional indicators such as the ADX or MACD. The idea behind this is that the price action and the shapes of the bars relative to each other is more accurate at defining the mood.
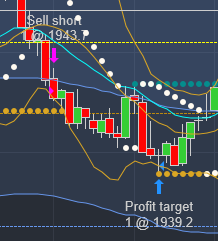
This basic indicator is simple but very powerful. It provides an entry, stop and trailing stop. Knowing when and how to employ this indicator is taught in the trading room.
December 2, 2024
Mastering Sideways Markets With Auction Bars and Range Projections
November 19, 2024
Enhancing Your Automated Trading System: Key Insights from Best Pro Trade
November 14, 2024
NinjaTrader New Ecosystem Tools: October 2024 Edition
Enter Email for Updates