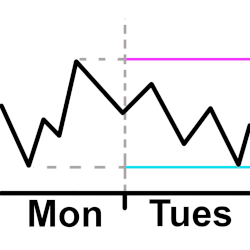
Plot a horizontal line for the high and low from the previous intraday. The user configures the open and close time they want to use for the intraday hours. This means the user can plot the high and low starting 30 minutes before the actual open and after the actual close if they want to.
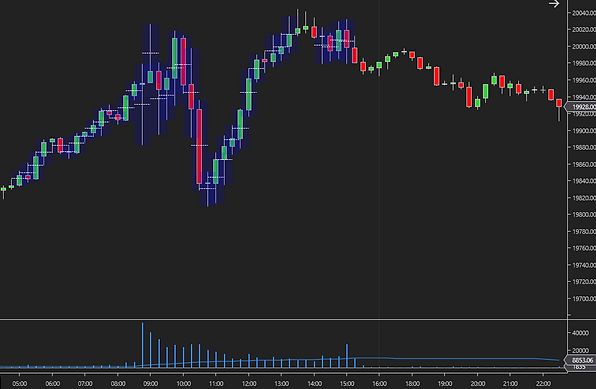
Elevate your trading strategy with the ATS Average Volume Pro indicator. This powerful tool showcases average volume with a customizable Simple Moving Average (SMA) and highlights each bar with above-average volume, making it easier for you to spot significant market moves.
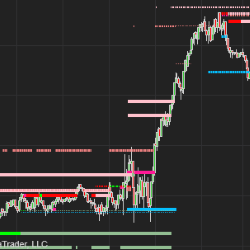
QSR Pro utilizes their advanced techniques to identify, validate, and invalidate support and resistance levels like never before. Unlike other indicators that rely solely on swing highs and lows, QSR Pro incorporates multiple factors to ensure precise support and resistance identification.
OTM Volume Profile is essential to understand the auction behavior and find key price reaction zones, such as the VPO, high and low value area. This profile preserves and allows to visualize these levels historically, which distinguishes it from static profiles.
Suite of four complementary indicators provides entry and exit alerts while offering valuable price momentum insights. These indicators can be integrated with your preferred setups and present price momentum in a visually engaging, color-coded format.
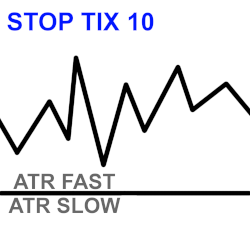
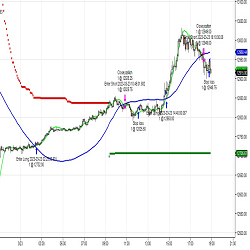
This indicator uses ATR calculations to help give an estimated stop-loss in ticks, which is displayed in an easy-to-read text box on the chart. It is also an excellent backtesting tool for quickly getting estimated stops when identifying past trade entries on historical bars.
The JATS™ Complete Package* includes the JATSLRTLines™ Indicator for NT8 as well as a comprehensive set of Black Box Shark Indicators BloodHound Templates customized for NinjaTrader Charts and the Market Analyzer.
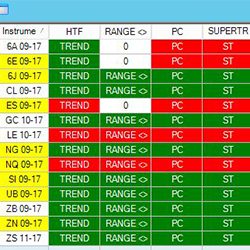
The JATS Market Analyzer Template for the NinjaTrader 8 platform has customized blackbox BloodHound solvers that show when momentum, linear regression and trend are in synchronization across multiple time frames.
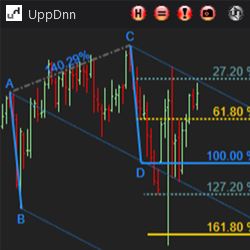
The Symmetry Drawing Tool helps quickly analyze symmetrical market movements by simply drawing a line from point A to point C. Add Fibonacci levels, customize appearance, add Andrew's Pitchfork with customizable levels and output a potential reversal area based on swing pattern logic!
Bstrader-automatic is a powerful trend following automated trading system. It has customizable parameters, different position sizing methods, fixed size, equity percentage, atr, price percentage, ATR Trailing Stop, Market Money Scale In and Scale Out, Volatility Compass, Daily loss limit and more.
December 2, 2024
Mastering Sideways Markets With Auction Bars and Range Projections
November 19, 2024
Enhancing Your Automated Trading System: Key Insights from Best Pro Trade
November 14, 2024
NinjaTrader New Ecosystem Tools: October 2024 Edition
Enter Email for Updates