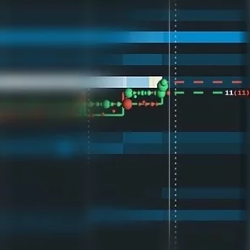
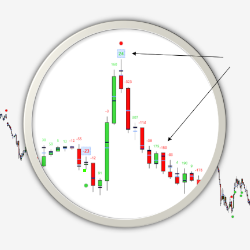
A fantastic way of using the Quotes Delta setting on Bookmap.com to identify whether important support and liquidity levels will hold or break, the Sweep Show setup has helped Nic understand when it was time to fade a move or go with it in E-mini S&P 500 futures.
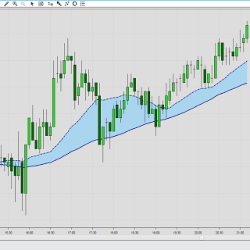
The Multiple MA Cross indicator plots a fast and a slow moving average. For both averages, users may select from over 30 different algorithms. The indicator can be used as a trend filter or for determining support and resistance.
Want to try everything before you buy? Use all of the Fibozachi trading indicators for a full month and take everything for a test drive! You'll have access to over 80 proprietary indicators that cover each and every aspect of trading — volume analysis, candlestick patterns, volatility signals, and more!
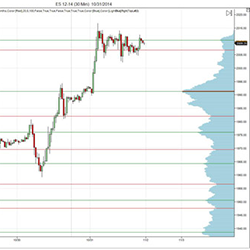
A1VolumeProfile is an easy way to add intraday and composite volume profiles to any chart. High and low volume nodes can indicate high probability areas for price predictability, and value areas indicate high probability areas for potential intra-day trend changes. Download a free trial!
To receive their free Weekly Market Movers trading schedule, just enter your email in the "" Get Free Training Video "" box. See how they schedule their trades each week as they will email you their free weekly trading schedule.
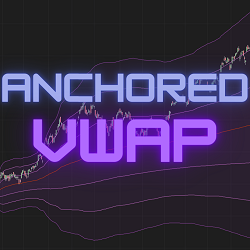
Enhance your trading with our point and click Anchored VWAP indicator for NinjaTrader 8. Built as an indicator, not a drawing tool. Features unique point-and-click anchor setting with hotkeys, 3 customizable deviation bands, and 8 VWAP calculation methods. Start your free trial today!
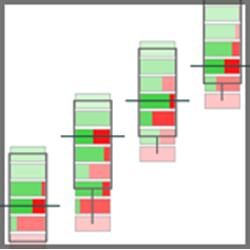
Identify the important buyer and seller zones in each candle by combining the processing of footprint information and a candle chart. Focus on your entries and exits. Get started today with a free 2-week trial!
LogikBarProfiler is a feature-rich bar volume / tick / price distribution heads-up display analysis tool. It displays data computed within each bar, as well as buyer v. seller distribution at price levels. This combines the usefulness of POC, delta, and activity analysis into one intuitive tool.
By subscribing to our Indicator Spotlight traders get a free monthly download from the LizardIndicators indicator library. All indicator features are documented with an explanation on how the indicator can be used in a trading strategy. Sign up today!
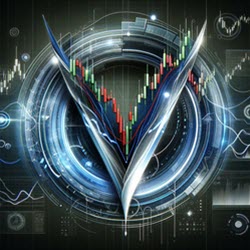
The V Reversal Trading System was developed to capture the V Reversal patterns that have become more frequent in the Nasdaq since 2022. This is a mean reversion pattern that takes advantage of a market that returns to its mean intra-day. This strategy trades the E-mini or Micro Nasdaq futures.
December 2, 2024
Mastering Sideways Markets With Auction Bars and Range Projections
November 19, 2024
Enhancing Your Automated Trading System: Key Insights from Best Pro Trade
November 14, 2024
NinjaTrader New Ecosystem Tools: October 2024 Edition
Enter Email for Updates