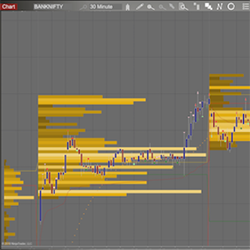
Bell-VSA is designed to consolidate both fundamental and technical analysis into a solitary approach. The Bell-VSA features Volume Spread Analysis Signals, volume profile & customizable colors.
With a potential of 1 trade per day, this system is automated from start to finish & designed to be monitored in some capacity. If you can remotely access a computer with the right software, then you can monitor these automated trades from the golf course (with a strong cell signal).
The Session Delta Pivot monitors the aggressive auction participants within a given session. By mapping this type of activity, the user can gauge the potential location for initiative activity as well as develop an understanding of directional day types.
Get all of the most critical indicators in one package. Market Levels provides VWAP, Value Area High/Low, Point of Control, Initial Balance, Open, High, Low, Close and more helping you identify key price areas. Levels are plotted for the full session and a user customized session.
Elevate your trading with CyMo Pro, a dual-indicator system for eMicro and eMini Indices. The Cycle indicator identifies key price movements, while the Momentum indicator confirms trade readiness. CyMo Pro’s algorithms anticipate reversals and track trends up to three bars ahead.
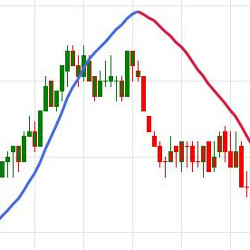
TC_TrendingTSF is a ‘smarter’ time series forecast line - a type of Linear Regression. By measuring the slope of the line, and the position of the line compared to price, this indicator can quite neatly reveal the current trend - even during sharp retracements. Free to download and use!
You can draw the risk/reward roulette tool at any point on a candlestick chart simply by clicking on the chart with the middle mouse button. This indicator allows you to speed up the drawing of the risk/reward tool on the chart by times, expanding on the functions of the trading platform.
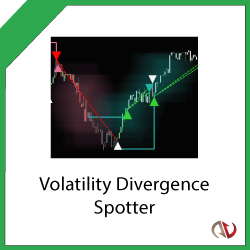
Spot the calm before the storm for both breakouts and breakdowns with this ultimate volatility indicator! Spot bullish accumulation and consolidation points before strong upward breakouts and continued bullish trends. Find points of failing strength at plateaus and tops before drops.
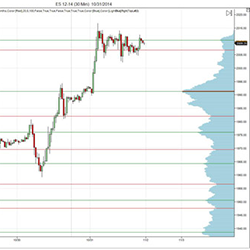
A1VolumeProfile is an easy way to add intraday and composite volume profiles to any chart. High and low volume nodes can indicate high probability areas for price predictability, and value areas indicate high probability areas for potential intra-day trend changes. Download a free trial!
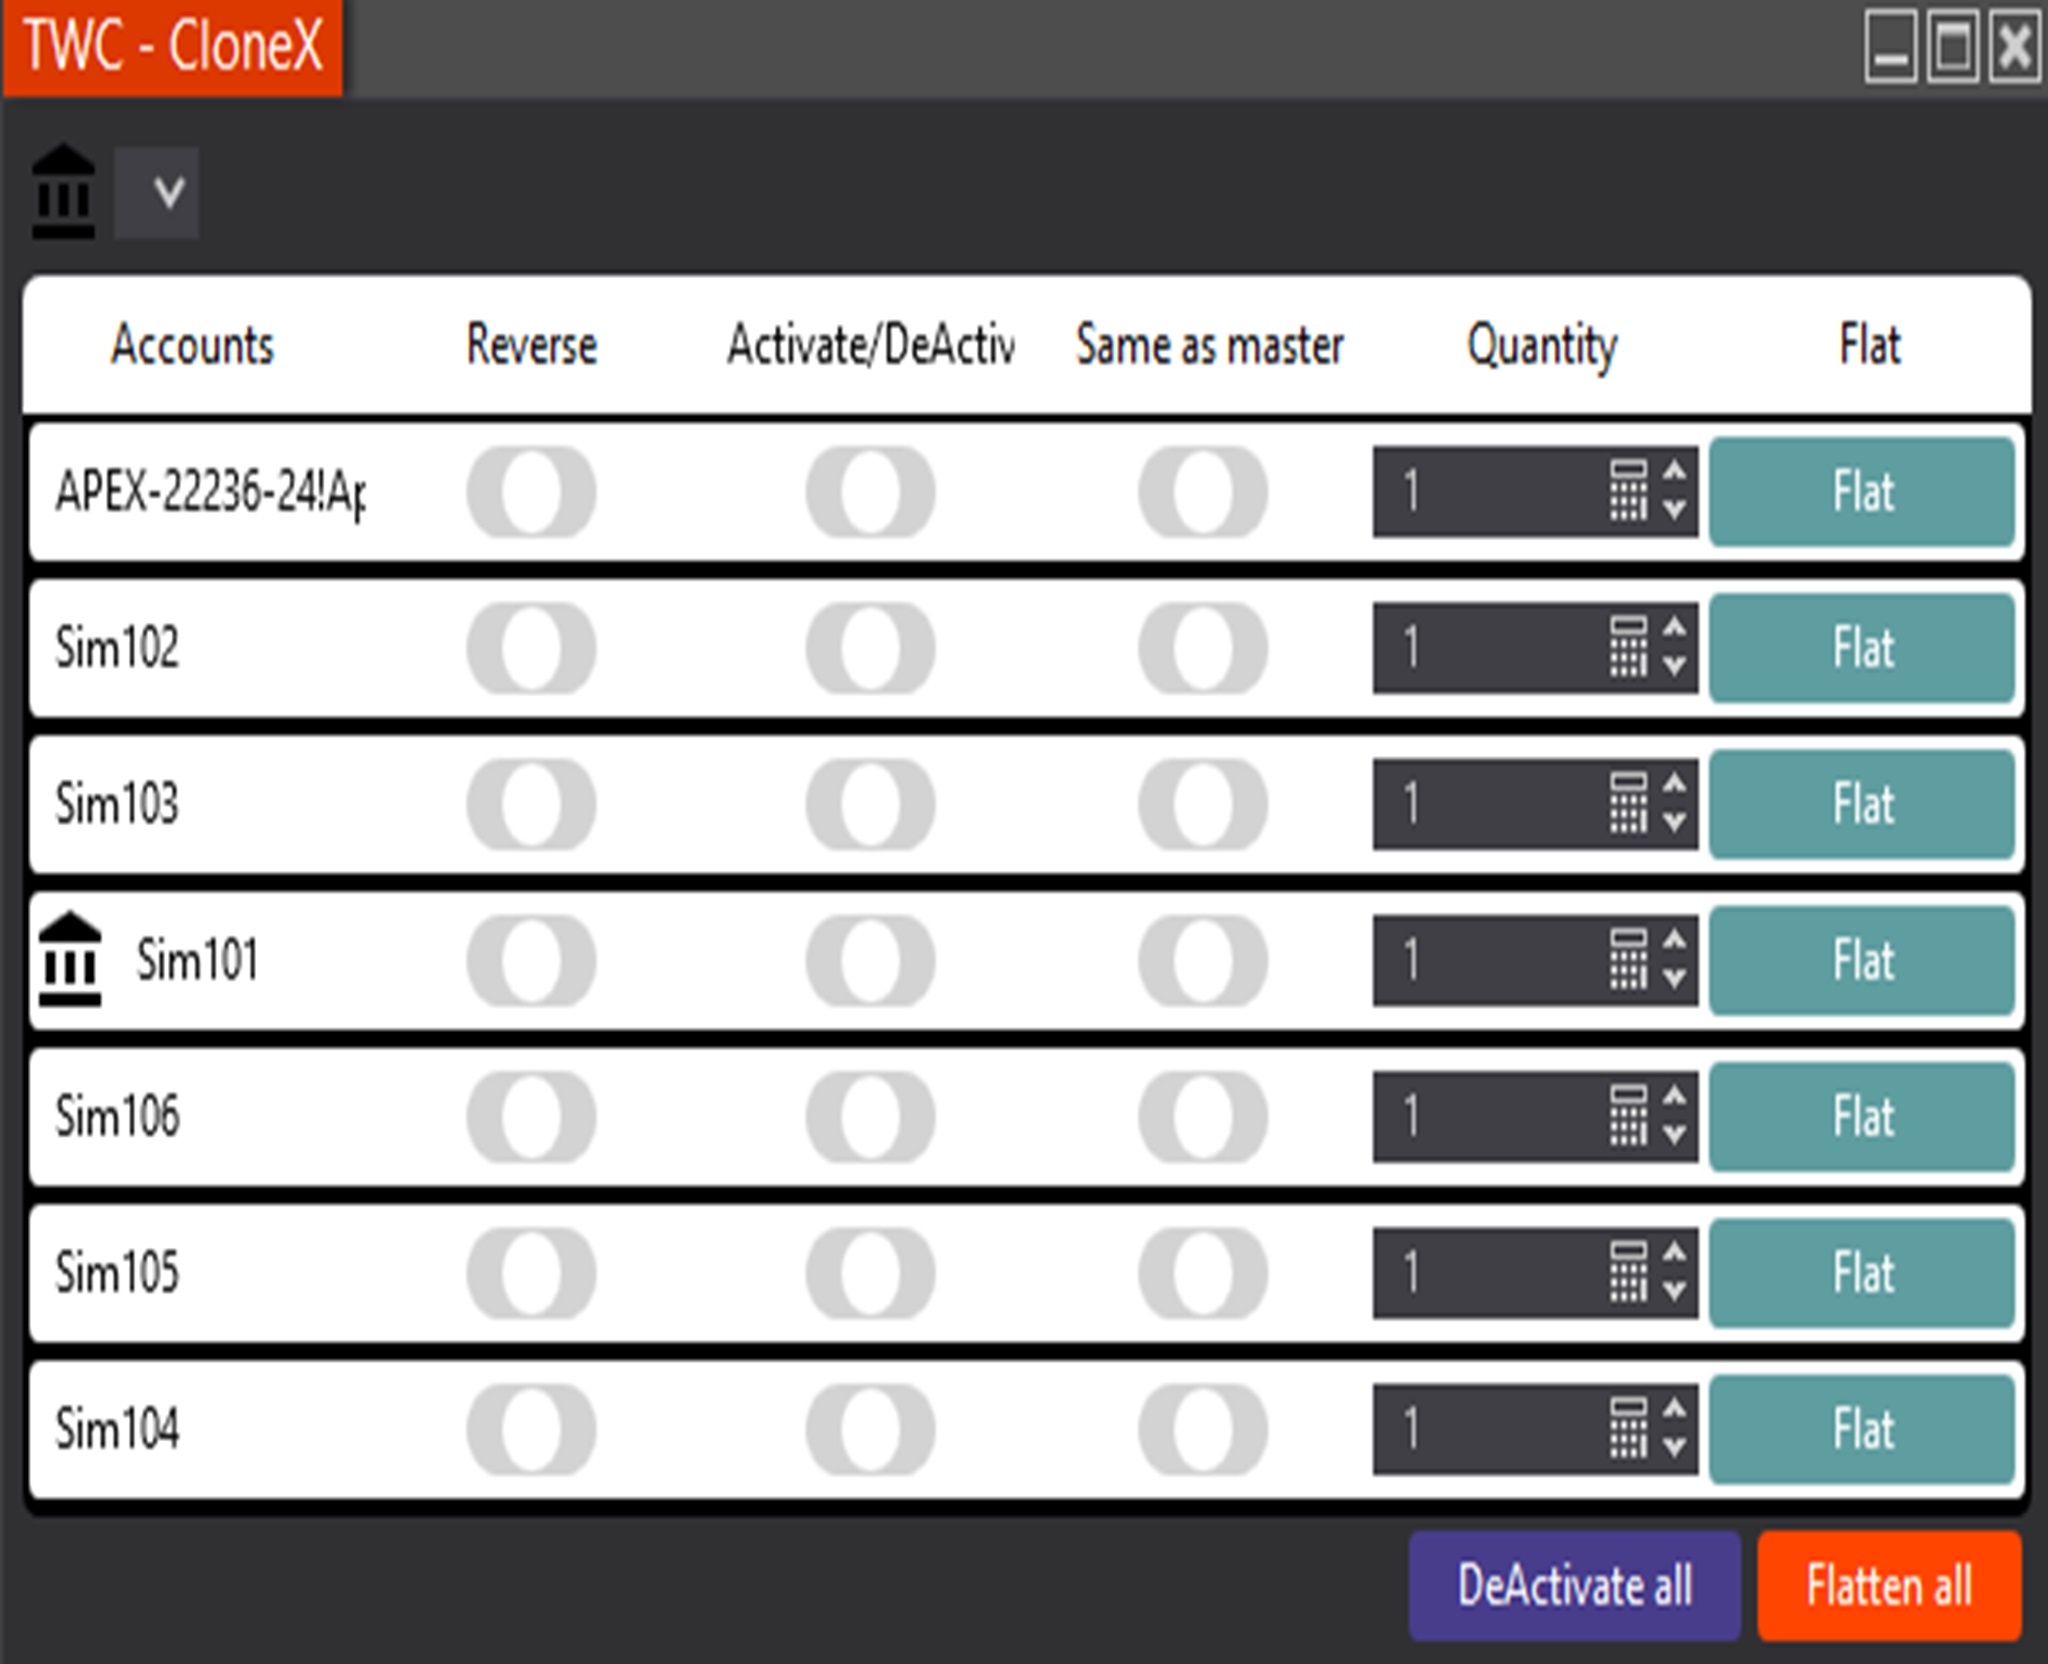
Introducing the advanced Trade Copier, a sophisticated solution for seamless copy trading. This digital product enables efficient trade copying from a master account to all connected accounts, ensuring uniform execution across your trading network.
December 2, 2024
Mastering Sideways Markets With Auction Bars and Range Projections
November 19, 2024
Enhancing Your Automated Trading System: Key Insights from Best Pro Trade
November 14, 2024
NinjaTrader New Ecosystem Tools: October 2024 Edition
Enter Email for Updates