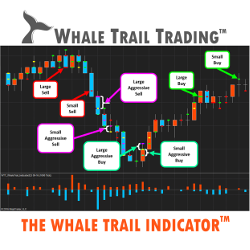
Let the Whale Trail Indicator replace years of reading trading books, attending lengthy and expensive seminars and unsuccessfully trading the markets. Easily follow the order flow in real time. Finally see how the largest whales trade the markets. Claim your free trial today!
A unique course with a specific, rule-based & mechanical/objective trading methodology. Designed to help traders identify entries & exits, define size, manage risk & control emotions when trading Futures Markets with their own characteristics & terminology. Get FREE access to the patented AutoUFOs®.
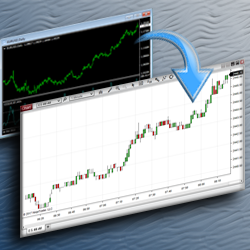
More Tech, LLC has over 10 years of experience working with MetaTrader, and have converted hundreds of indicators and strategies to be compatible with the NinjaTrader platform. Contact them today to receive a free estimate for having your code converted from MQL to NinjaScript.
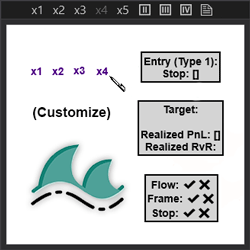
This indicator allows the user to create custom text buttons and quickly draw them on the chart, increasing application functionality and user charting efficiency.
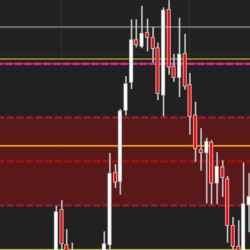
The Session Delta Pivot monitors the aggressive auction participants within a given session. By mapping this type of activity, the user can gauge the potential location for initiative activity as well as develop an understanding of directional day types.
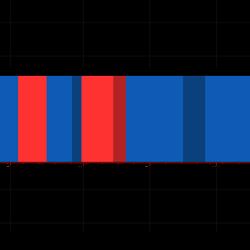
Stay in your trades for longer using our HeatMap indicator. One of the toughest problems can be getting into a trend or staying in a trend until the end. HeatMap looks at 4 factors which determine a trend and displays the results in an easy-to-read heatmap right on your charts.
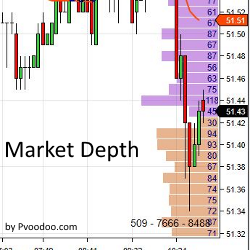
The addition of Market Depth indicators allow traders to see the bid/ask data based on price in real time. Similar to the Level II data featured in the NinjaTrader SuperDOM, the Market Depth Indicator plots bid/ask data directly on a chart. Learn more!
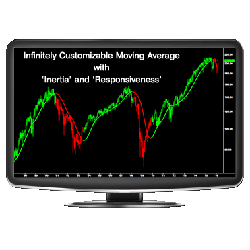
The ZMA™ is the most adaptable and customizable moving average indicator to date. By using an algorithm that incorporates the concepts of inertia, energy, and responsiveness, the ZMA is infinitely flexible and significantly more effective than other moving averages available.
PureMO & ScalpMO: The ultimate combo for momentum and scalping mastery. Track momentum, dominate scalping. Two cutting-edge tools in one package, built to transform your trading. Try it free for 7 days and see the difference!
The “opening range” is the range obtained from the highest and lowest price of a security during the first minutes of daily trading activity. The JATS Opening Range Indicator displays the OR and the current open of the RTH session for a defined time period, as well as the pre-session Globex.
December 2, 2024
Mastering Sideways Markets With Auction Bars and Range Projections
November 19, 2024
Enhancing Your Automated Trading System: Key Insights from Best Pro Trade
November 14, 2024
NinjaTrader New Ecosystem Tools: October 2024 Edition
Enter Email for Updates