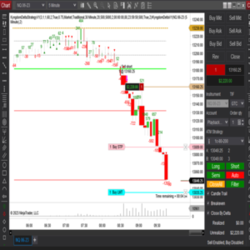
Delta Volume Supply and Demand Indicator that comes with a Semi Auto Chart Trader. Prop firm compliant for evaluations and live accounts. Reads what is happening right now in the market with no lag. Templates, workspaces and manual included. Works in all markets. Free 7-day Trial.
This trading book is for the those traders struggling with psychology and entries with practical examples provided.
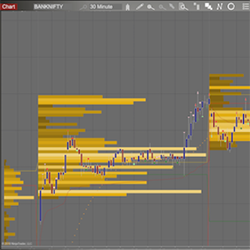
Bell-VSA is designed to consolidate both fundamental and technical analysis into a solitary approach. The Bell-VSA features Volume Spread Analysis Signals, volume profile & customizable colors.
You can download and try our best indicators for NinjaTrader 8 now! These indicators are free to try. 24-hour technical support and all future updates included. Watch video tutorials on indicator details and how to use them. Hurry! Click here to download and try now!
Learn a battle-tested strategy for trading the markets in under 60 mins per day. Here’s just a fraction of what you’ll learn: How professional traders find good trades, how to read the markets and a market that has unique advantages over others.
Performs real-time analysis of the volume and price trends to color the lower panel of the chart with actionable information. When both are trending in the opposite direction, the panel will be colored purple to mark this "unusual behavior." Start using this key Information in your trade plan today!
SpeedyAlert is a free tool that sends you an email notification if a running application crashed, stalled or is short on RAM & other critical resources. This is a very useful tool for PC’s hosting 24/7 automated strategies. Avoid these not so funny “surprises” & download SpeedyAlert today!
The Fibonacci Angle Fan forward plots equidistant Fibonacci trendlines from a single cast point.This provides leading edge Fibonacci Support & Resistance forecasting. Ideal for Price Action traders.Combine with traditional Fibonacci Technical Analysis methods & max tap the Fib Golden Ratio of 1.618%
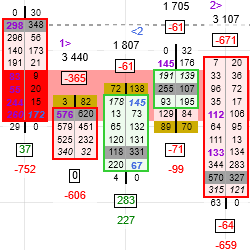
GomOrderflowPro displays the following data: sells, buys, delta & the associated calculations. It computes buy/sell imbalances & builds the associated support and resistance zones. The plots are available for building strategies or populating the Market Analyzer window. Free 2-week trial available.
Custom Development Services are tailored for NinjaTrader users, offering bespoke solutions across markets. They provide real-time cryptocurrency data integration, custom indicators, strategies, and add-ons to optimize trading performance and profitability.
December 2, 2024
Mastering Sideways Markets With Auction Bars and Range Projections
November 19, 2024
Enhancing Your Automated Trading System: Key Insights from Best Pro Trade
November 14, 2024
NinjaTrader New Ecosystem Tools: October 2024 Edition
Enter Email for Updates