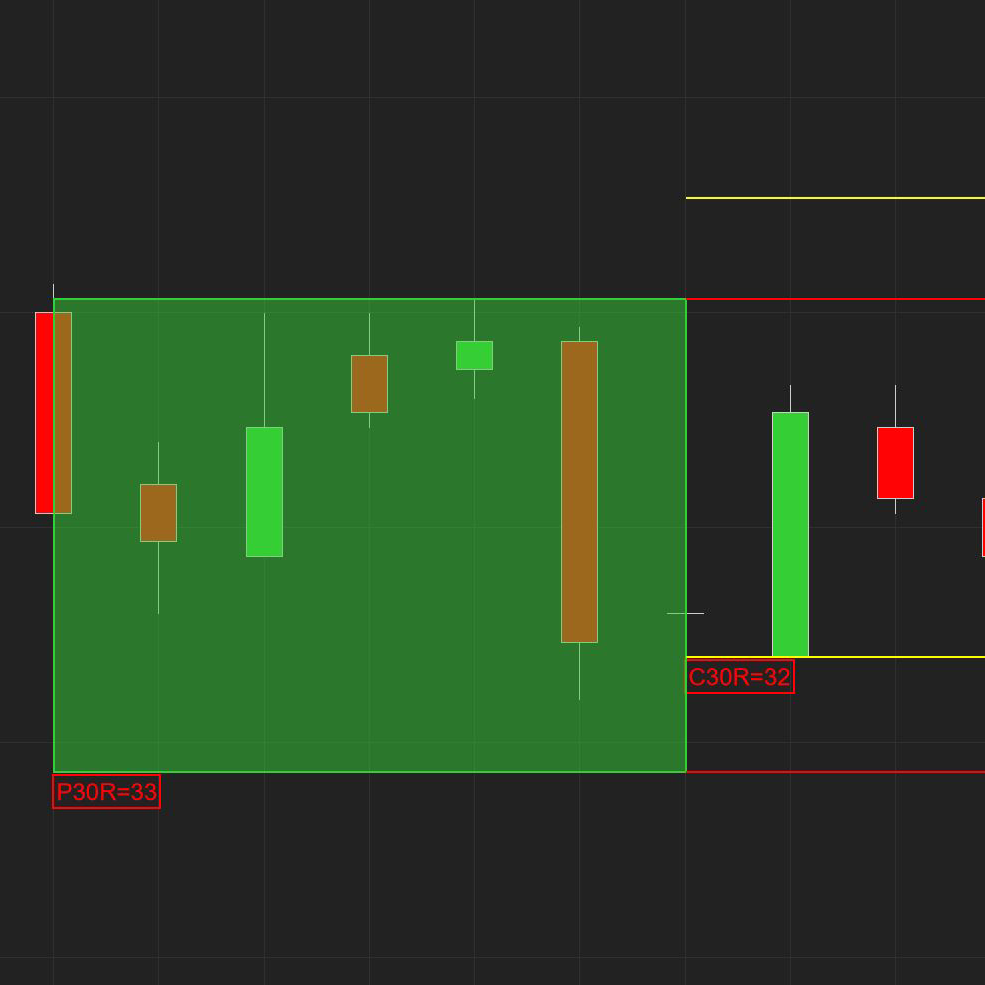
The purpose of the Free 30-Minute Range Indicator is to display visually the Previous 30-Minute Period and the Current 30-Minute Period's relationship to the previous period.
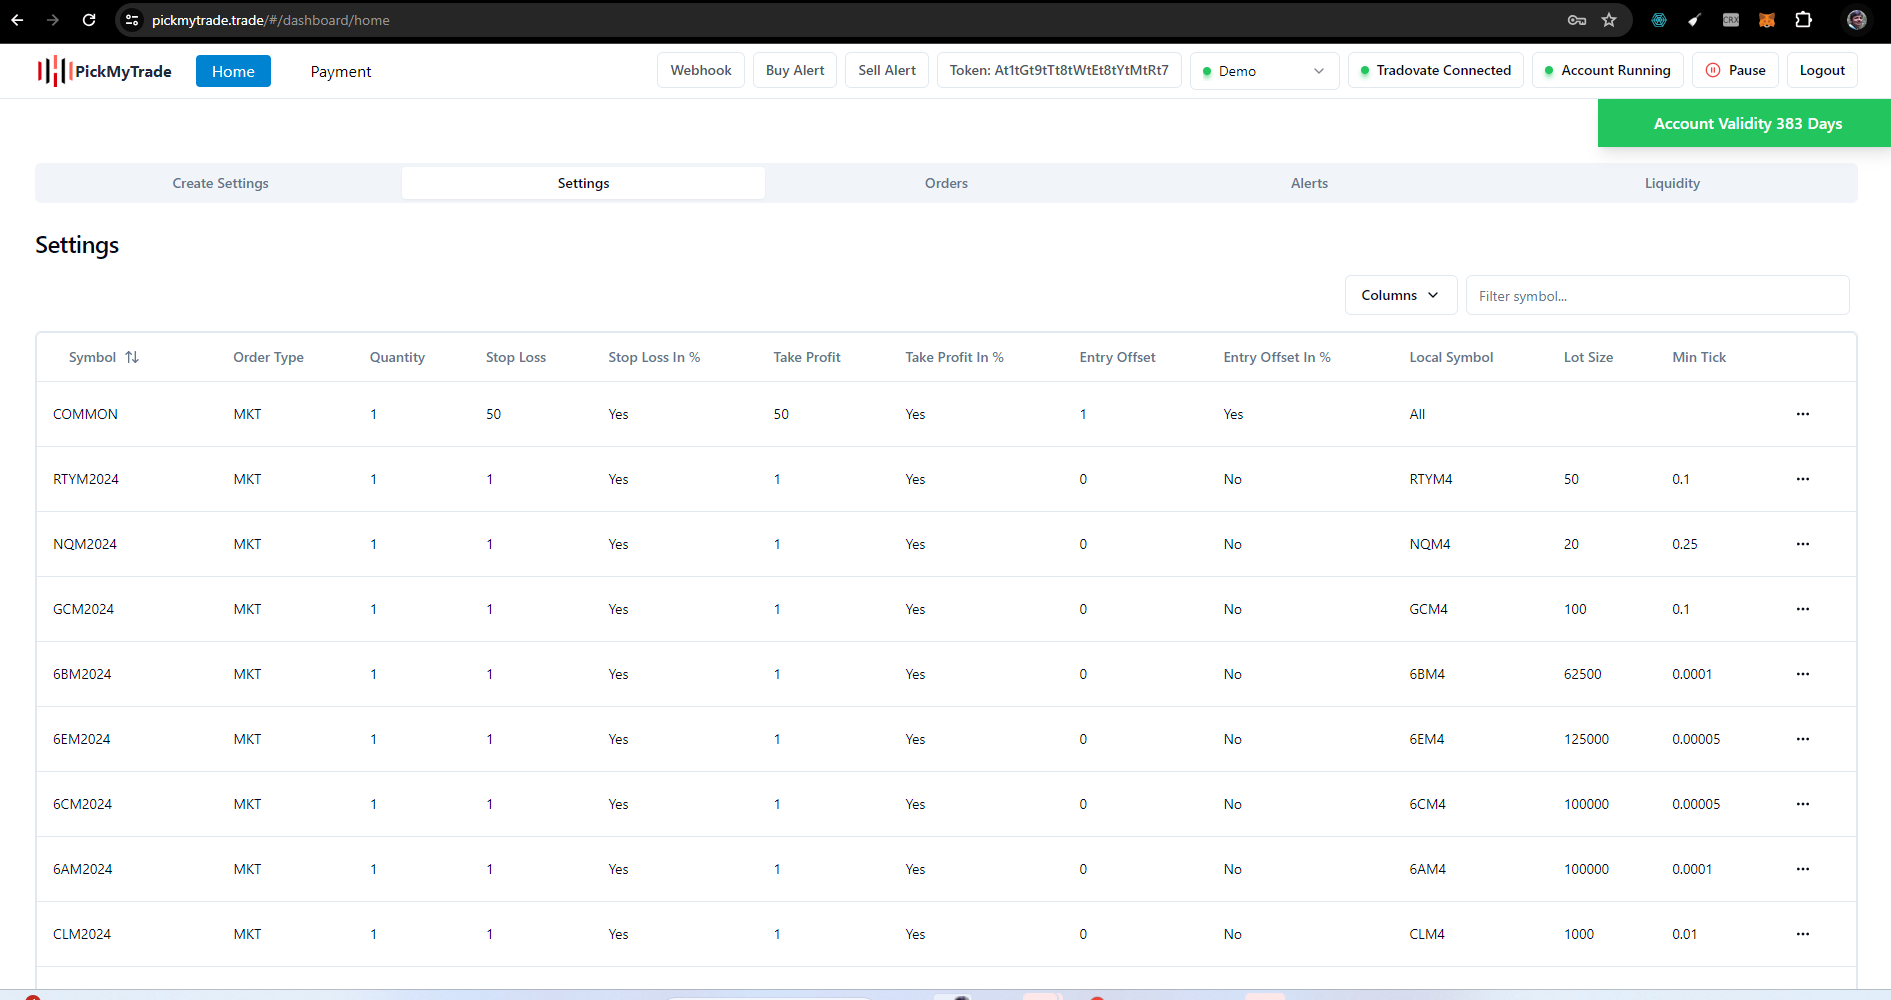
PickMyTrade specializes in automating trading bots, enabling seamless strategy execution for futures across well-known brokers such as Tradovate.
The Ichimoku Mentoring Program contains 4 weeks of pre-workshop webinars, a live 2-day boot camp, 2 months of post course mentoring, access to the trade room & Ichimoku research center. Learn more!
Trade with me every day and track the biggest financial institutions with Volume Profile. Receive the strongest volume-based trading levels twice a day, daily video commentary every day, the strongest swing trading levels, swing trading videos, access to members forum, video course & much more.
In the rapidly evolving landscape of the stock market, traditional trading strategies and indicators often fall short in the face of complex and volatile market conditions. This is where Artificial Intelligence (AI) steps in, revolutionizing the way investors approach trading.
The market is either trending or ranging. This indicator from Tyche Trading gives you the power to know exactly when it is ranging with a high level of precision. Their Auto-Trading Range Indicator makes it easy to know what price to enter and exit your trades at. Get a seven-day free trial today!
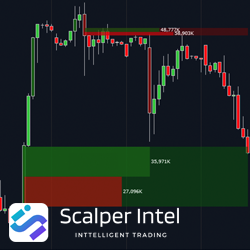
The Fair Value Gap (FVG) from ScalperIntel is an indicator that identifies inefficiencies (or imbalances) in the market and then marks the upper and lower limits of the gaps. The Bull and Bear FVG’s are plotted along with the bull/bear volume profile from the gap start.
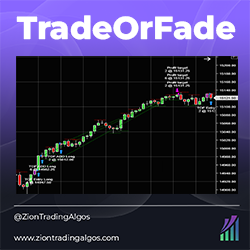
TradeOrFade is a momentum-based intraday strategy on the 5-minute chart. It determines whether or not there is an opening gap on NQ and takes advantage of statistically relevant information regarding gap ups and gap downs. It takes a starter position and pyramids into the position.
This incredibly innovative suite of Bollinger Bands and divergence indicators shows selected, plotted ‘dots’ with a broad selection of Bollinger Band combinations. You can choose from seven indicator combinations!
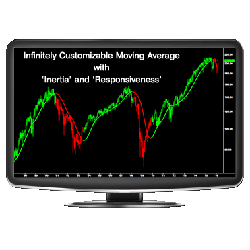
The ZMA™ is the most adaptable and customizable moving average indicator to date. By using an algorithm that incorporates the concepts of inertia, energy, and responsiveness, the ZMA is infinitely flexible and significantly more effective than other moving averages available.
December 2, 2024
Mastering Sideways Markets With Auction Bars and Range Projections
November 19, 2024
Enhancing Your Automated Trading System: Key Insights from Best Pro Trade
November 14, 2024
NinjaTrader New Ecosystem Tools: October 2024 Edition
Enter Email for Updates