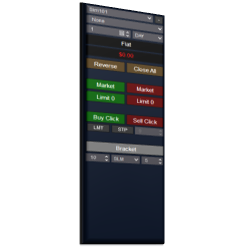
Streamline your trading with semi-automated tools that efficiently manage positions, whether long or short, across specific instruments in your account.
This masterclass on day trading the E-mini Futures is a two hour, in-depth, start to finish walkthrough of the Fib Retracement day trading strategy that EminiMind has used on the E-mini S&P for nearly 15 years. It can also be used on the micros and Forex.
Bold Bot is a strategy for NQ which will analyze the product for long trades.
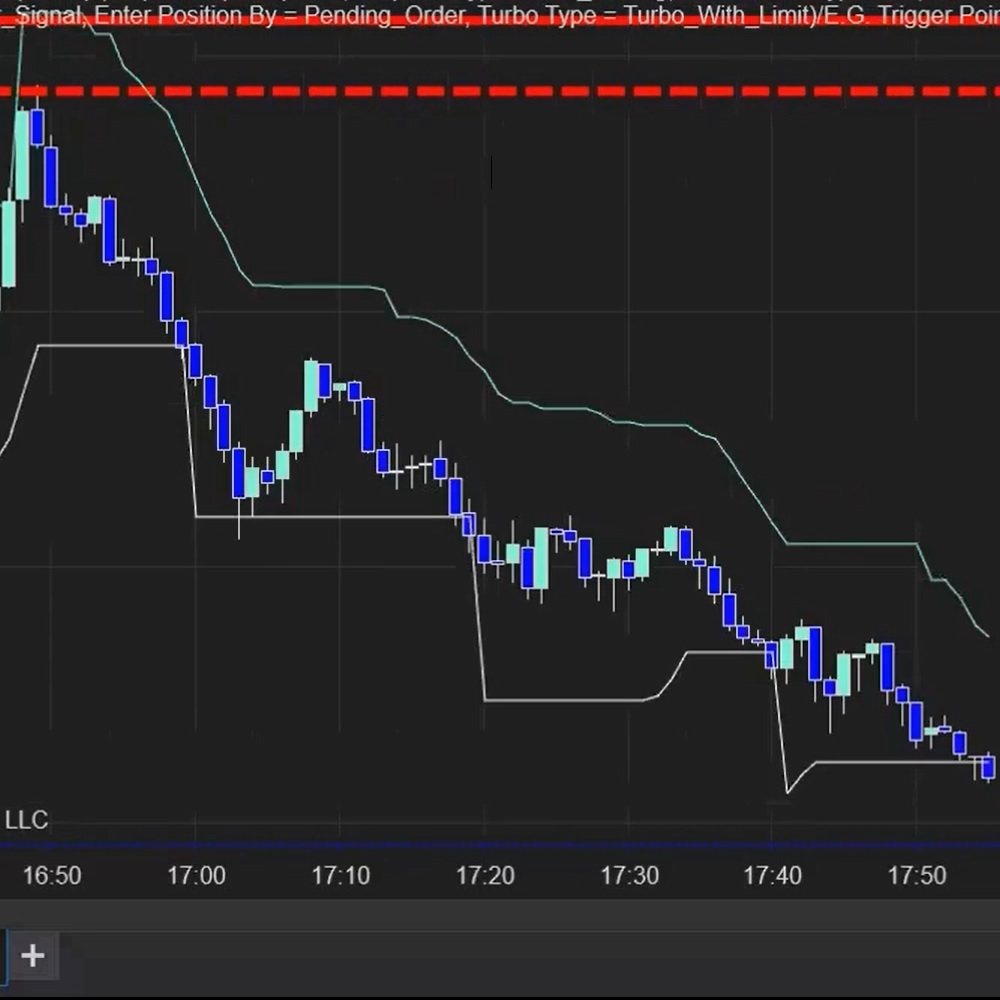
The E.G. Trailing Stop draws the trailing path for you. It considers the asset’s volatility; based on the Average True Range (ATR), it estimates the next price level to optimize your profit targets.
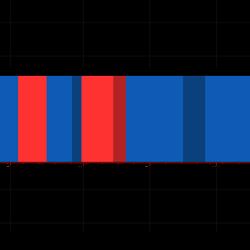
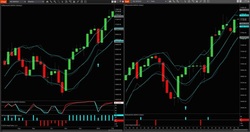
Stay in your trades for longer using our HeatMap indicator. One of the toughest problems can be getting into a trend or staying in a trend until the end. HeatMap looks at 4 factors which determine a trend and displays the results in an easy-to-read heatmap right on your charts.
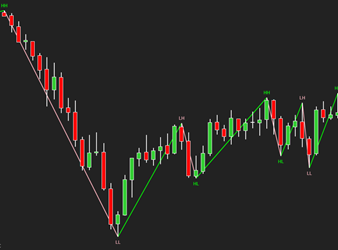
The ZigZag indicator is primarily used to identify significant highs and lows in the price chart, which helps traders filter out market noise and focus on important price movements.
IATrend gives a clear indication of the trend of any financial instrument and does so on all different time frames.
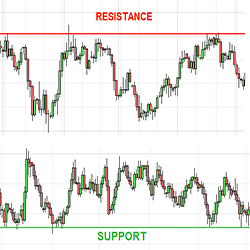
Plots chart and/or synthetic support and resistance lines from a higher time frame.
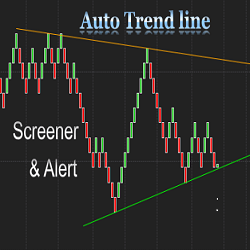
The Auto Trend Line Alert indicator will automatically plot the upper and lower trend lines based on the most recent swing points. It works on all timeframes. The NinjaTrader Market Analyzer makes it possible to track price action related to trend lines in any timeframe.
The Bracket Entry Orders module is great for capturing momentum in fast moving market during periods of high activity or following a news event. The “Bracket” button gets the last traded price and initiates a buy order above the market and a sell order below the market simultaneously.
December 2, 2024
Mastering Sideways Markets With Auction Bars and Range Projections
November 19, 2024
Enhancing Your Automated Trading System: Key Insights from Best Pro Trade
November 14, 2024
NinjaTrader New Ecosystem Tools: October 2024 Edition
Enter Email for Updates