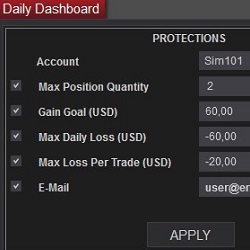
Protect your losses in a trade and daily basis. Do not grow a position more than planned. Daily Dashboard is the tool to support you against your bad behavior in the stressful moments.
Q-PZone provides visual naked volume point of control (VPOC) zones. These VPOC zone levels are significant because they can act as a support or resistance level.
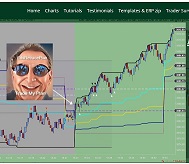
Free Discord EdsRetracePlan with Markers Plus CHAT. Using a single indicator and Range charts, you can automate CL, NQ and GC trade entries by turning on Markers Plus. Trades will be taken using the ERP long or short signals. Talk in the free Discord chat about how easy it is to trade with ERP & MP.
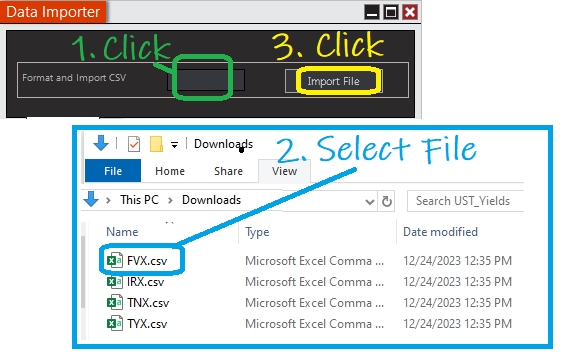
Quickly import any TXT or CSV data file into NinjaTrader for charting and analysis. Handles 450 different data formats. Historical price data, economic data and crop data can now be displayed inside NinjaTrader.
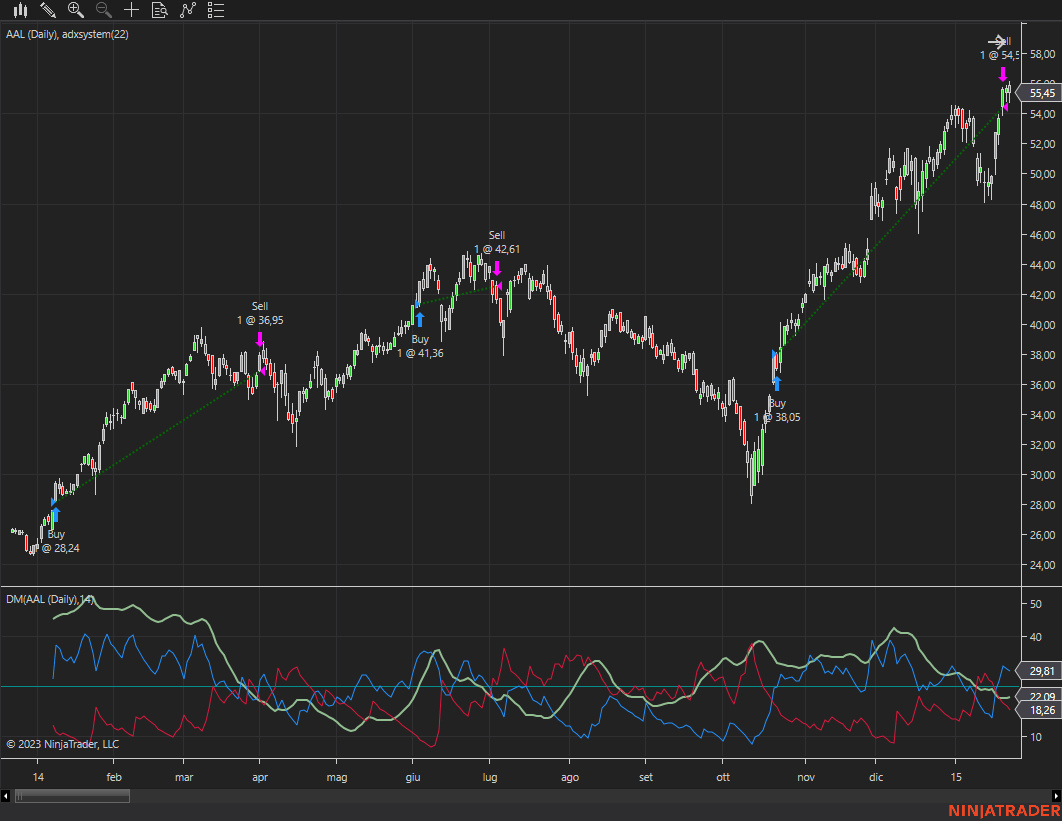
ADX trading system detecting price direction as well as trend strength.
The Trend Pullback Reversal (TPR) Indicator displays possible price trends with pullback and reversal signals. TPR will focus on the main trend and filter out most minor price movements. The NinjaTrader 8 version comes with a unique band and center line as additional features.
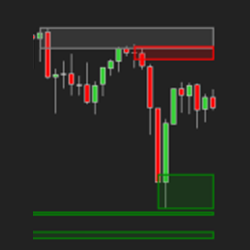
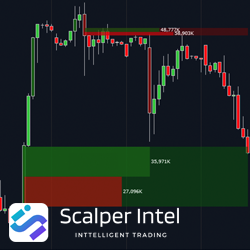
The Fair Value Gap (FVG) from ScalperIntel is an indicator that identifies inefficiencies (or imbalances) in the market and then marks the upper and lower limits of the gaps. The Bull and Bear FVG’s are plotted along with the bull/bear volume profile from the gap start.
This chart analysis package helps you move forward quickly, detecting opportunities and enhancing trading decisions. Trade with greater confidence and consistency. Quick-to-learn, rules-based strategy. Email alerts so you don’t miss an opportunity. Management tools help entering or exiting a trade.
The world’s first self-optimizing SuperTrend indicator. It uses spearhead third-generation scanning to identify actionable signals. Performance metrics like profit factor and number of winners are displayed on the chart to determine potential results.
Use the experience of a quantitative trading system professional to help design, test, improve or optimize your trading strategy. Get a complete system analysis to have the confidence that your strategy performs exactly how it was designed to.
December 2, 2024
Mastering Sideways Markets With Auction Bars and Range Projections
November 19, 2024
Enhancing Your Automated Trading System: Key Insights from Best Pro Trade
November 14, 2024
NinjaTrader New Ecosystem Tools: October 2024 Edition
Enter Email for Updates