This fully-automated trading strategy from Indicatortrader works on both NinjaTrader 7 & 8. It can operate 24 hours a day can be implemented in equity, futures and forex markets. Use this strategy to backtest years of historical data to find the best possible trading hours.
By subscribing to our Indicator Spotlight traders get a free monthly download from the LizardIndicators indicator library. All indicator features are documented with an explanation on how the indicator can be used in a trading strategy. Sign up today!
Rose provides one-on-one coaching for traders. She guides students on various topics: Psychology, her Fibonacci trading system, mindset, performance, risk management, etc. Rose helps traders get to the next level of their trading career. Get started with a free consultation with Rose today!
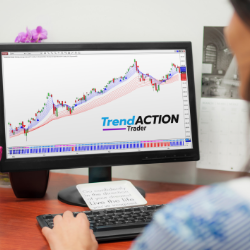
Trend Action Trader keeps you on the right side of the market with clear high probability signals for all markets and timeframes. Its price patterns and momentum algorithm are ideal whether you trade short or long term. Improve your trading consistency - try risk-free for 30-days!
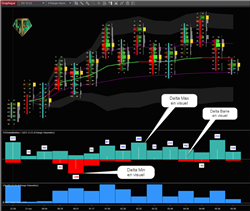
This indicator will visually tell you the evolution of this OrderFlow data: Delta / Delta Min / Delta Max. Ideal for detecting Delta divergences. No need to read the NinjaTrader statistics table anymore! Please note, you must have the NT8 version allowing access to OrderFlow.
B4 CoPilot simplifies trend direction with a visual representation in chart background colors, shows optimal trade entry points with arrows and price regions. It also has several models that execute semi-autonomous order flow entry, using our institutional grade day trading engine.
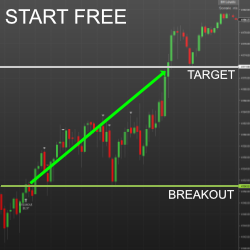
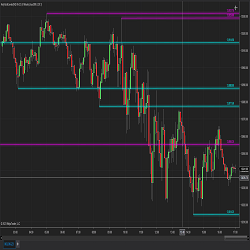
This algorithm calculates the support and resistance based on a look back period (number) of candles or bars and determines the support and resistance levels dynamically.
TS Custom Analysis is precise support and resistance based custom technical analysis in the style of TS TradePlan. Analysis can be done for markets specified by clients. Email TraderSmarts today for a free quote.
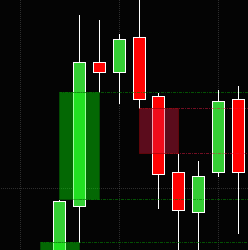
ICT's Fair Value Gap indicator retains a configurable number of gaps, and there's a setting to remove those that have been crossed by price. The style of the rectangle and the rays from the gaps are customizable by creating a template for a rectangle named "FVG Up Gap" (for the Up gaps).
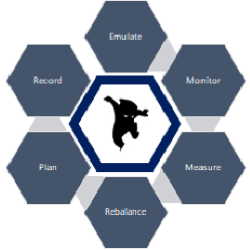
The Tradelytics platform enables investors, wealth managers and analysts to emulate and execute portfolio management with the live market data for both simulated and live portfolios. The portfolio is measured for risk and reward. Users anywhere can record fundamental and technical analyses.
December 2, 2024
Mastering Sideways Markets With Auction Bars and Range Projections
November 19, 2024
Enhancing Your Automated Trading System: Key Insights from Best Pro Trade
November 14, 2024
NinjaTrader New Ecosystem Tools: October 2024 Edition
Enter Email for Updates