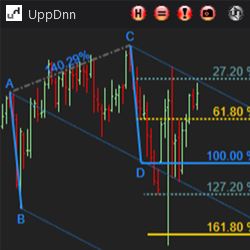
The Symmetry Drawing Tool helps quickly analyze symmetrical market movements by simply drawing a line from point A to point C. Add Fibonacci levels, customize appearance, add Andrew's Pitchfork with customizable levels and output a potential reversal area based on swing pattern logic!
QuantCycles harnesses artificial intelligence (AI) and machine learning (ML) for superior predictability, stability and chart analysis. With refined algorithms using advanced Fourier cycle analysis, Hurst cycles and W.D. Gann theories, this latest version delivers exceptionally accurate forecasting.
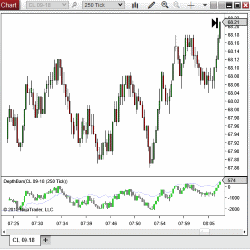
The Depth Bars & Pull-stack indicators by PureAlgo Capital detect changes in the total bid depth and total ask depth, providing a better idea of whether the bulls or bears are in control of the market & which players are about to fold.
Rose provides one-on-one coaching for traders. She guides students on various topics: Psychology, her Fibonacci trading system, mindset, performance, risk management, etc. Rose helps traders get to the next level of their trading career. Get started with a free consultation with Rose today!
Price Action Harvester™ scans all markets to find consistent price action patterns based on historical data. Know how price moved for any instrument on particular days, during particular time-frames. A powerful tool for day traders. Don't miss this indicator!
The VWAP Predator uses VWAP as a zonal guide with Bull and Bear Bands. It then uses logic to recognize accumulation and distribution candles. If those candles cross from a zone to another, then a Signal Candle is produced. Buy Signals in the Bullish Bands and Sell Signals only in the Bearish Bands.
Increase your trading confidence by scheduling your one-on-one performance coaching and mentoring session with one of our seasoned and experienced traders. Beginner, intermediate or advanced topics can be discussed with our Certified Mental Performance Coaches.
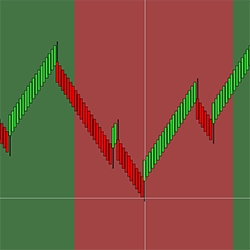
Reversal Bars is an indicator showing you when & where it will plot a reversal bar from as many as five times frames on a single chart.
You can download and try our best indicators for NinjaTrader 8 now! These indicators are free to try. 24-hour technical support and all future updates included. Watch video tutorials on indicator details and how to use them. Hurry! Click here to download and try now!
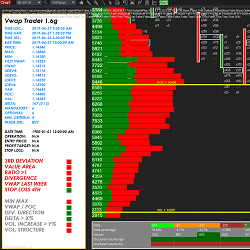
itcVwapTrader is a strategy for NinjaTrader 8 which is based on the mean reversion and the use of orderflow (vwap, footprint, market profile) for precise entries. This strategy uses more than 14 criteria for decision making. The strategy is highly customizable and comes in 3 versions.
December 2, 2024
Mastering Sideways Markets With Auction Bars and Range Projections
November 19, 2024
Enhancing Your Automated Trading System: Key Insights from Best Pro Trade
November 14, 2024
NinjaTrader New Ecosystem Tools: October 2024 Edition
Enter Email for Updates