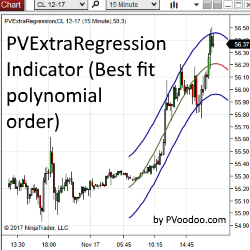
PVExtraRegression Indicator & Strategy is a regression channel taken to the next level, calculated using higher order polynomials. Use PVExtraRegression as a discretionary indicator or automated strategy!
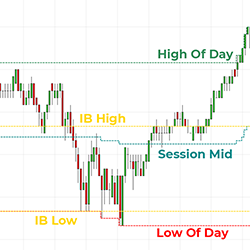
Initial balance, session mid & day mid are common market profiling levels used in day trading futures, stocks & ETF’s. This indicator automatically plots and updates these levels on any intraday chart, providing clear targets for trade entries & exits. Get started now and enhance your charts!
A powerful self-study program that will help you learn the core principles and implementation of the Hunt Volatility Funnel Method with a total of 18 hours of material, topic by topic, alongside case studies and live trading webinars.
XABCD News puts news events on your chart so you're not surprised when news comes out. It works in any market and provides a visual marker for scheduled economic news for the current seven-day week, from Sunday to Sunday. Get your free copy today.
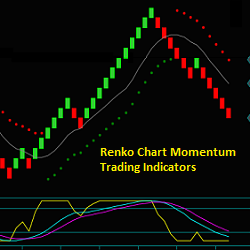
The Renko chart trading method and trading indicator training include Renko chart momentum reverse trades that begin a new swing, trading pullbacks with momentum resumption and flow for price continuation, and trading swing reverses with price and momentum extremes or divergences.
Become a pro trader with four 1-on-1 trading sessions dedicated entirely to you! Learn price action via a 26+ chapter Price Action Trading Course. Detailed guides show you how to find signals & set up your charts to do much more. A lifetime membership, live daily analysis & chatroom are included.
Simplify your trading & save monitor real-estate with the TradeFinder Market Analyzer Add-On. This tool drills-down to dissect & monitor multiple markets, timeframes & instruments to spot trends, momentum & price action in real time, complete with pop-up, email & audible alerts! Learn how!
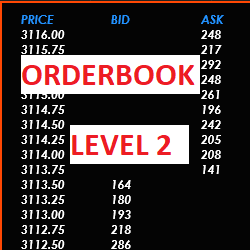
itcOrderBook is a Ninja Trader 8 indicator that displays the order book for the current asset (market depth or level 2). Ask & Bid are displayed on the price ladder and colors & text size can be customized at will. Users can set the location X,Y where the box will display.
Volatility Quality Indicator (VQI) is a technical indicator that was developed to identify quality stocks with low volatility. The indicator is based on the assumption that assets with low volatility are less risky & more stable. The original concept by Thomas Stridsman was first published in 2002.
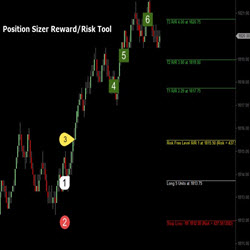
This tool auto-calculates position size based upon account value and percentage risk parameters input by trader. Displays the Entry Price, Stop Loss, and up to Three (3) Price Targets based on R-values. If you a serious trader, then this is an essential addition to your trader toolbox.
December 2, 2024
Mastering Sideways Markets With Auction Bars and Range Projections
November 19, 2024
Enhancing Your Automated Trading System: Key Insights from Best Pro Trade
November 14, 2024
NinjaTrader New Ecosystem Tools: October 2024 Edition
Enter Email for Updates