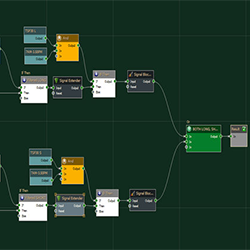
Custom strategy design in BloodHound. Remek! will program your trading strategy as per your specifications and requirements. Learn more!
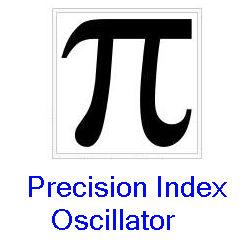
Precision Index Oscillator (Pi-Osc) can provide trade timing signals and is a consensus indicator with some powerful variances to industry standard oscillators. At first glance, it would appear like any other oscillator, but when viewing it in tandem with other indicators the differences are clear.
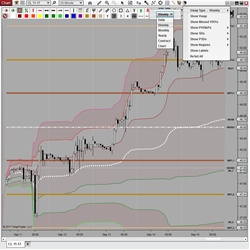
VWAP Plus features 7 configurable Session Types (Daily, Weekly, Monthly, Contract, etc.) and 3 user defined upper and lower standard deviations. It displays 17 Unique Current & Previous Levels, includes a toolbar icon for easy setup, and is Market Analyzer, Strategy Builder & Bloodhound ready!
CryptoSignal is a must-have trading signal app for cryptocurrency traders, offering accurate signals for Bitcoin, Ethereum, Dogecoin, Solana, Cardano, and more. Enjoy a 3-day free trial to test its precision. Available on both iOS and Android, CryptoSignal provides timely insights.
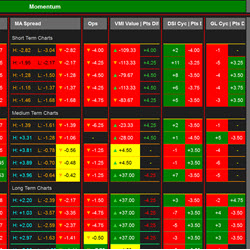
Market Pulse delivers extensive insights into market momentum and reversals across 15 time frames on a single screen, utilizing innovative modern indicators and chart patterns.
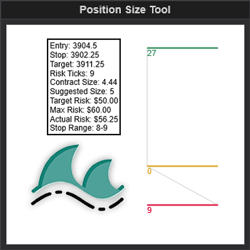
This indicator allows the user to get the position size based on the stop size of the Risk Reward tool. This increases application functionality and user charting efficiency.
The algorithm works by continuously processing live data such as time & sales, volume, tape pace and tape acceleration. The algorithm performs real-time analyses, dynamically adapting to identify aggressive buyers and sellers actively influencing the market.
This tool and indicator helps you spot trigger entries with such features as one 4-range and one 14-range data series chart and one indicator. It's a simple, clean and very effective price-retrace system. Follow EdsRetracePlan to learn exactly when and where to buy or sell on price retraces.
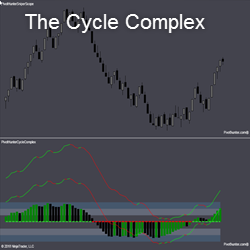
THE CYCLE COMPLEX measures price momentum at 4 levels: the histogram, 2 lines of higher sensitivity, and a dotted bull bear line. When the histogram is in the bands and turns, the pivot is often stronger. If the histogram is above or below the bands, the strength is even greater.
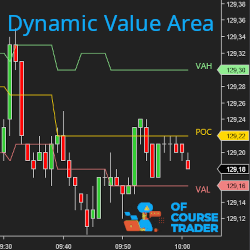
The Dynamic Value Area allows you to visualize in real time the evolution of the POC, VAL, VAH levels corresponding to the most traded value area. It also gives you historical levels. Its NinjaScript API will allow you to integrate the value area into your own indicators and strategies.
December 2, 2024
Mastering Sideways Markets With Auction Bars and Range Projections
November 19, 2024
Enhancing Your Automated Trading System: Key Insights from Best Pro Trade
November 14, 2024
NinjaTrader New Ecosystem Tools: October 2024 Edition
Enter Email for Updates