The ultimate semi-auto trading strategy that harnesses the power of a premier indicator, Peaks. This innovative tool gets you into trades, automatically as a signal is generated, eliminating the need for manual entries. Peak's Semi Auto also offers automated exits, using their custom Auto PT logic.
This masterclass delivers on all fronts, providing all the fundamental knowledge and practical trading skills required to trade any asset class and in any market conditions. This course is designed specifical for those committed to making trading their career. Diploma plus gain your trading skills.
QSR Pro utilizes their advanced techniques to identify, validate, and invalidate support and resistance levels like never before. Unlike other indicators that rely solely on swing highs and lows, QSR Pro incorporates multiple factors to ensure precise support and resistance identification.
The EPyFSwingLevels indicator identifies the most relevant structure levels. Once the indicator is loaded within a chart, it automatically reflects areas where the price reacts.
ABC Trader is for the more advanced and discretionary trader looking for consistency. This easy-to-read indicator helps to identify trades. It includes a predesigned workspace, ready-to-use ABC Rules, and advises what to expect from the markets.
The Helix strategy is the combination of our Entry Zone indicator and the Trade Management strategy, hence the name Helix (or double Helix). Helix allows you to create your Entry Zones based on your setup rules. Then, after trade execution, Helix will manage the trade based on your rules.
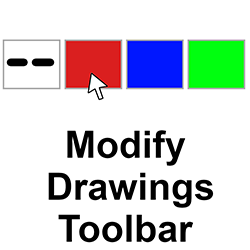
Trying to change line types and colors requires opening the properties box. It's also tricky to set a line or ray to be exactly horizontal. This toolbar contains various tools to help with those frequent property changes. It will even move your object endpoint to the chart's end.
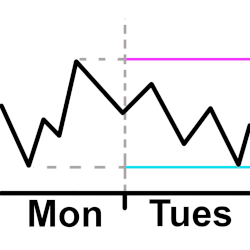
Plot a horizontal line for the high and low from the previous intraday. The user configures the open and close time they want to use for the intraday hours. This means the user can plot the high and low starting 30 minutes before the actual open and after the actual close if they want to.
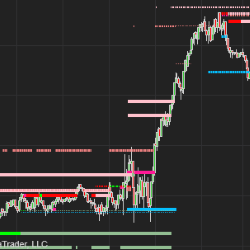
By automatically drawing significant price levels, such as ADR (Average Daily Range) min and max values, yesterday’s OHLC, pivot points (S1, S2, S3 and R1, R2, R3), and weekly OHLC levels, this indicator offers valuable insights to help you make more informed trading decisions.
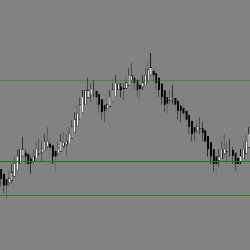
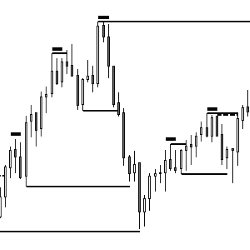
This indicator shows Double Bottoms and Double Tops which are tested by subsequent price action. It shows micro Double Bottoms & micro Double Tops as well. Use it as a discretionary indicator and for automated trading (e.g. BloodHound). Get started with a free 20-day trial today!
December 2, 2024
Mastering Sideways Markets With Auction Bars and Range Projections
November 19, 2024
Enhancing Your Automated Trading System: Key Insights from Best Pro Trade
November 14, 2024
NinjaTrader New Ecosystem Tools: October 2024 Edition
Enter Email for Updates