Don't miss any more targets by a few ticks with Target Zone!
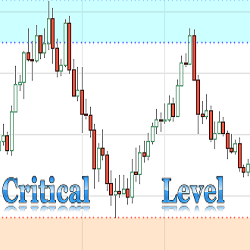
The purpose of this indicator is to automatically plot critical support and resistance levels on a chart. The Critical Support & Resistance Level Indicator comes with customizable alerts and can be added as a Market Analyzer column.
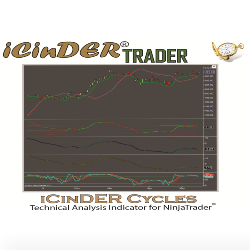
iCinDER™ Cycles indicators provide traders with the basic 3 iCinDER Cycles, Minor, Intermediate and Major. The indicators provide overbought/oversold visualization as well as visualization of bullish and bearish bias. The analysis is based on cycles of the instrument being analyzed.
Trading requires edge, but in the new world of machine and algorithmic trading disrupting information processing and decision making, it’s incredibly elusive. Boss Trading addresses this problem by introducing professional experience and trader role modelling via live trading masterclasses.
The Median Convergence Divergence (MCD) is a derivative of the Moving Average Convergence Divergence (MACD). The difference is the change in the use of the measure of central tendency. In MACD, moving average (mean) is used, whereas, in MCD, the median is used instead. Click to learn more.
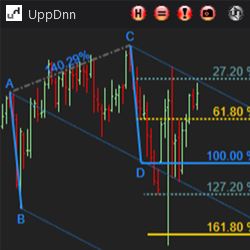
The Symmetry Drawing Tool helps quickly analyze symmetrical market movements by simply drawing a line from point A to point C. Add Fibonacci levels, customize appearance, add Andrew's Pitchfork with customizable levels and output a potential reversal area based on swing pattern logic!
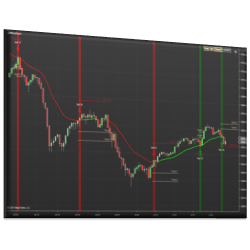
This indicator plots signals, targets, and stops based on support and resistance from various moving average types. The trend is established based on a minimum number of bars above or below the moving average. The signal is initiated on the first touch of the moving average.
Welcome to the 7 Steps for Consistent Trading Performance. This free 7-day video course teaches about the three strategy stats based on probabilities to help you build a sustainable, scalable and reproductive (SSR) strategy for achieving consistent performance.
This course, in French, details the step-by-step path to profitability, from the basics of trading to order flow, and the best known indicators. This course is the result of months of work and years of experience. Satisfied or your money back for 14 days – try it out!
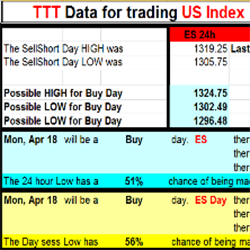
Based on the trading techniques of George Taylor, the TTT E-Book provides the necessary data to trade using the Taylor Trading Technique. After the market close receive 24 hour and daily data to plan your trades for the next trading session. Free 1-week trial available!
December 2, 2024
Mastering Sideways Markets With Auction Bars and Range Projections
November 19, 2024
Enhancing Your Automated Trading System: Key Insights from Best Pro Trade
November 14, 2024
NinjaTrader New Ecosystem Tools: October 2024 Edition
Enter Email for Updates