Die TrendTechnik® ist ein neuer eigenständiger und in sich geschlossener Fachbereich. Mit trendtechnischen Methoden werden Tradern sowie Analysten besondere Situationen sichtbar und nutzbar, die vielen Anderen verborgen bleiben. Erfahre mehr und nutze die deutlich besseren Möglichkeiten und Chancen.
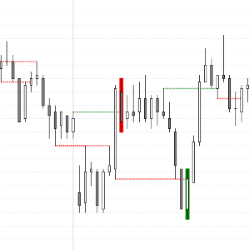
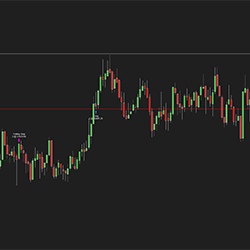
This indicator shows Breakout Tests or Breakout Pullbacks of broken support and resistance in real-time. As a beta feature you can also test Failed Breakouts. Use the Breakout Test indicator as a discretionary indicator in your day trading. Get started with a free 2-week trial today!
The Zerolag HATEMA is based on a TEMA that uses Heikin-Ashi candles as input series. This indicator does not depend on the selected input series, as it uses open, high, low and close of each candle.
Boost your trading with the OTS indicator collection! Includes key tools like average profit/loss, market spread, and more for enhanced market analysis. Ideal for every trader. Start now!
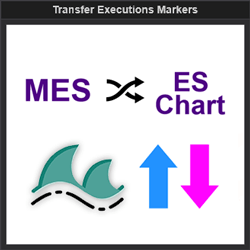
This indicator allows the user to obtain execution data from one instrument and overlay it on another. This increases application functionality and charting efficiency.
The algorithm allows for fully automatic trading or semi-automatic. It works in Micro or Micro futures markets. For the algorithm to manage the trades, you can set a stop-loss and target from the configuration menu. If you want, you can also choose NinjaTrader’s ATM Strategy.
What a lovely day yesterday was! Do you ever wonder if there were similar days in the history of a trading instrument, and what happened thereafter? With the Similar Days Project, view price scenarios for 24 different currency pairs. This technology is scalable on any market.
Master quantitative trading with our courses. From back-testing basics to advanced strategy development, learn to build systematic trading systems. Explore futures, pairs trading, & essential Python programming tailored for financial markets. Gain a trading edge with real-world examples. Enroll now!
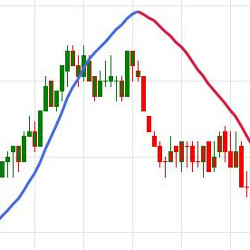
TC_TrendingTSF is a ‘smarter’ time series forecast line - a type of Linear Regression. By measuring the slope of the line, and the position of the line compared to price, this indicator can quite neatly reveal the current trend - even during sharp retracements. Free to download and use!
Bold Bot is a strategy for NQ which will analyze the product for long trades.
December 2, 2024
Mastering Sideways Markets With Auction Bars and Range Projections
November 19, 2024
Enhancing Your Automated Trading System: Key Insights from Best Pro Trade
November 14, 2024
NinjaTrader New Ecosystem Tools: October 2024 Edition
Enter Email for Updates