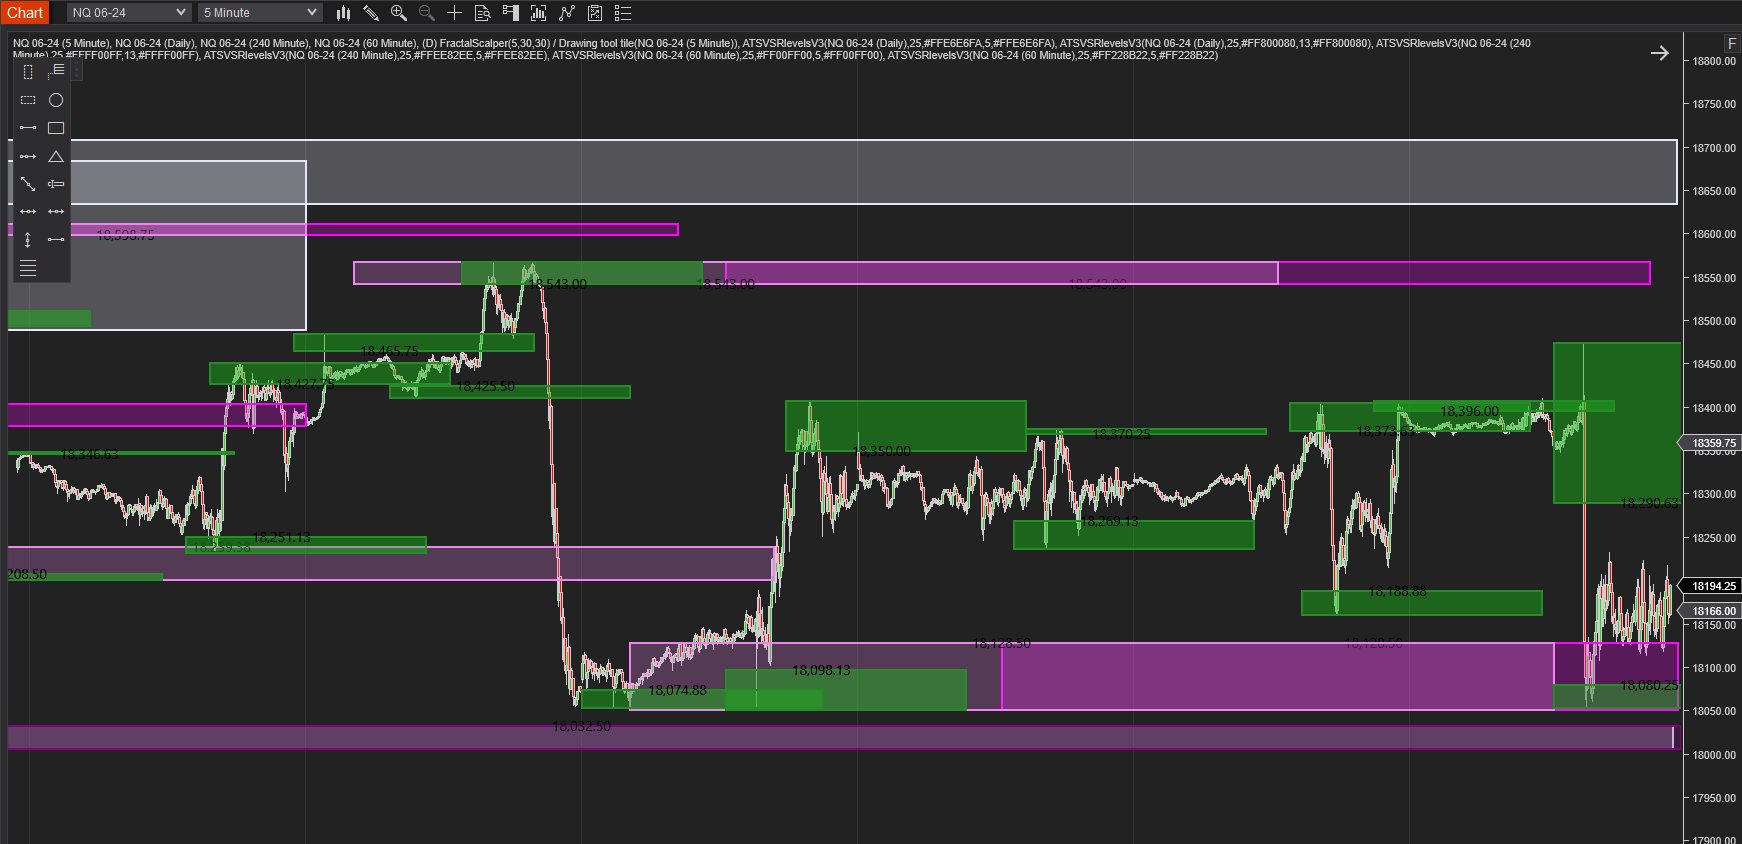
This indicator is designed to provide the trader with better trade locations by plotting visual support and resistance levels at swing points in the market. When multiple data series are used, the ATS VSR Levels can be plotted using the higher timeframe.
Fibonacci LevelsL Institutional Support and Resistance Levels by DTB Traders offer unparalleled accuracy for futures market trading. With automatic adjustments for new highs and lows, save hours on analysis across multiple instruments and time frames.
This automated trading strategy for NinjaTrader 8 does not need any adjustment and is ready to be used out of the box. Newly created & designed for the Micro E-mini S&P 500 futures market, it has been thoroughly backtested over many weeks and is fully-functional.
YMI University is designed to pack the utmost essential content into one trading course. It's designed to give you a new level of understanding of how the stock market works, how to get started, and how you can utilize your abilities to excel and grow.
The experts say, "The Trend is your friend." DiNapoli Levels teaches you how to define ''Trend'.' The experts say, "Buy strength and sell weakness." This book teaches you how to buy weakness in an uptrend and sell strength in a downtrend, and of course, where exactly to take your profits.
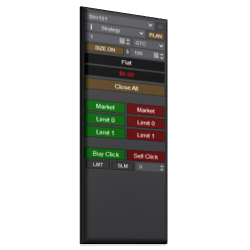
The Essential Chart Trader Tools is a starter pack for the Enhanced Chart Trader. It is full of features to help traders focus on decision making, remove stress and minimize mistakes. The Essential Chart Trader Tools can be added to any chart window in NinjaTrader.
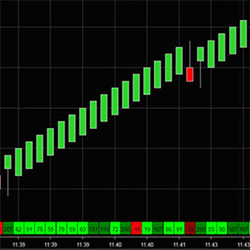
Market Delta Volume Profile is designed to distinguish if buyers or sellers are in control & to see breakdown of volume in each bar. It’s used to identify price reversal areas and look into the price action of each Renko bar to view volume profile, price & monitor order flow.
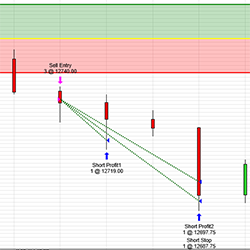
This strategy will trade the opening range and provide targets and stops. It will also trail after each target is hit. The trail and stop levels can be customized as well as the targets.
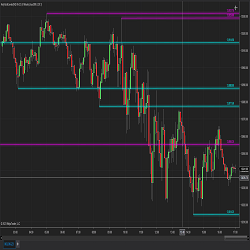
This algorithm calculates the support and resistance based on a look back period (number) of candles or bars and determines the support and resistance levels dynamically.
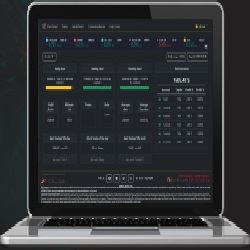
The best risk management dashboard tool, with an intuitive web platform that provides complete control, protection & detailed visualization of the evolution of all trading accounts. Optimized for propfirm trading, our solution is the ultimate choice for traders and teams. Click to learn more!
December 2, 2024
Mastering Sideways Markets With Auction Bars and Range Projections
November 19, 2024
Enhancing Your Automated Trading System: Key Insights from Best Pro Trade
November 14, 2024
NinjaTrader New Ecosystem Tools: October 2024 Edition
Enter Email for Updates