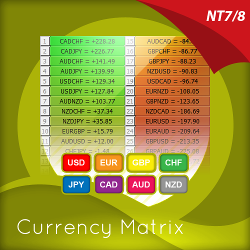
The currency matrix indicator is a simple solution to a complex problem, revealing sentiment for the currency across the currency complex. Now traders can know when they're trading with the universal flow, not against it. Learn more about this unique Forex indicator for NinjaTrader!
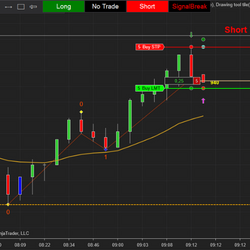
Trade two-legged pullback with this Second Entry Indicator! This is a semi-automated, two-legged pullback strategy using the built-in trading-buttons. Get alerts and your orders are placed automatically at the correct spot (no more dragging orders).
The program combines TradingTotal traditional technical analysis methodology with the latest technology automated systems & tools. It is carried out through intense online/onsite live seminars & webinars, 'EduHome' video recorded seminars, supportive coaching and a unique individual mentor program.
Convert indicators, strategies and algorithms from any platform to NinjaTrader 7 or NinjaTrader 8! Contact Patternsmart for a quote today!
This robust pattern recognition strategy for day trading futures, stocks and FX has been used for Crude Oil futures trading since November 2017. It includes fully customizable parameters based on your individual risk tolerance level. Contact us to lease/purchase or explore synergistic opportunities.
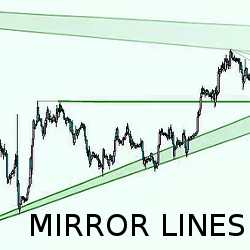
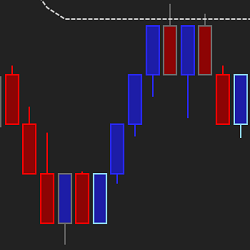
Receive trend forecasts in NinjaTrader 7. MirrorLines paints graphics on the chart that spread out like a torch beam, representing forces hidden within the market’s price structure. Traders can use this data to plan trade entries, stop losses, and smart profit targets.
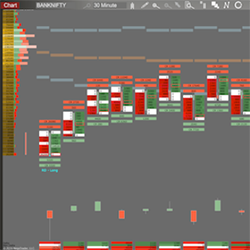
Track volume profile in three timescales easily! Optimal Vision analyses point of control and value area breakouts in three rolling lookback periods of your choice and color-codes your bars by strength of signal. A simple way to bring dynamic volume profile to your trading! Strategy compatible.
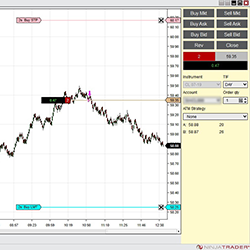
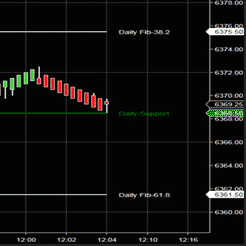
Trading123 Automatic Fibonacci Pivots draws the Fibonacci levels for you. No more second guessing as to where the price action is going. The Fibonacci levels move with the price action from one level to the next. Precise trading using price action for entries and exits at Fibonacci levels.
Bell R-Delta Alert provides a 360 degree microscopic view of the markets and is particularly designed for Scalpers, Intraday and short term players. The Bell R-Delta features onscreen, audio and email alerts!
The Easy E-mini E-book package details specific trade setups using standard indicators that are available with every download of NinjaTrader. The package comes pre-designed workspaces and templates, unlimited video library access & a 3-day chat room trial!
December 2, 2024
Mastering Sideways Markets With Auction Bars and Range Projections
November 19, 2024
Enhancing Your Automated Trading System: Key Insights from Best Pro Trade
November 14, 2024
NinjaTrader New Ecosystem Tools: October 2024 Edition
Enter Email for Updates