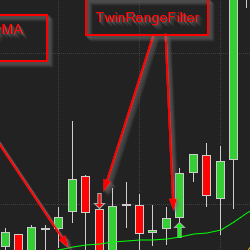
The Twin Range Strat employs two indicators (the Twin Range Filter and the RedKSmoothAndLazyMA) to genterate ATM Orders. The quantity, stops and trailing are all handled by the ATM and you, if you like!
The Helix strategy is the combination of our Entry Zone indicator and the Trade Management strategy, hence the name Helix (or double Helix). Helix allows you to create your Entry Zones based on your setup rules. Then, after trade execution, Helix will manage the trade based on your rules.
If you’re struggling with specific issues such as your entry or even your exit or developing a strategy that works for you, the first port of call is a free 15-minute consultation where we can discuss your needs and formulate a 1-on-1 mentoring plan. Reach out no matter what your trading issue is!
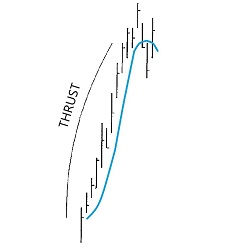
With this tool, traders can now find charts which have potential DiNapoli Directional patterns. Scan multiple markets & time frames in real time for Thrust and other patterns. Use as a chart indicator for easy recognition or as a market analyzer. Video instructions are included - try it today.
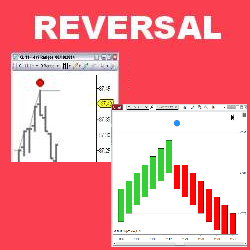
This indicator detects possible reversal bars using Stochastic overbought & oversold conditions & paints entry signals in real time. The Stochastic levels are fully customizable & each reversal signal features a horizontal Reversal Breakout Order line marking sell stop entry levels. Try today!
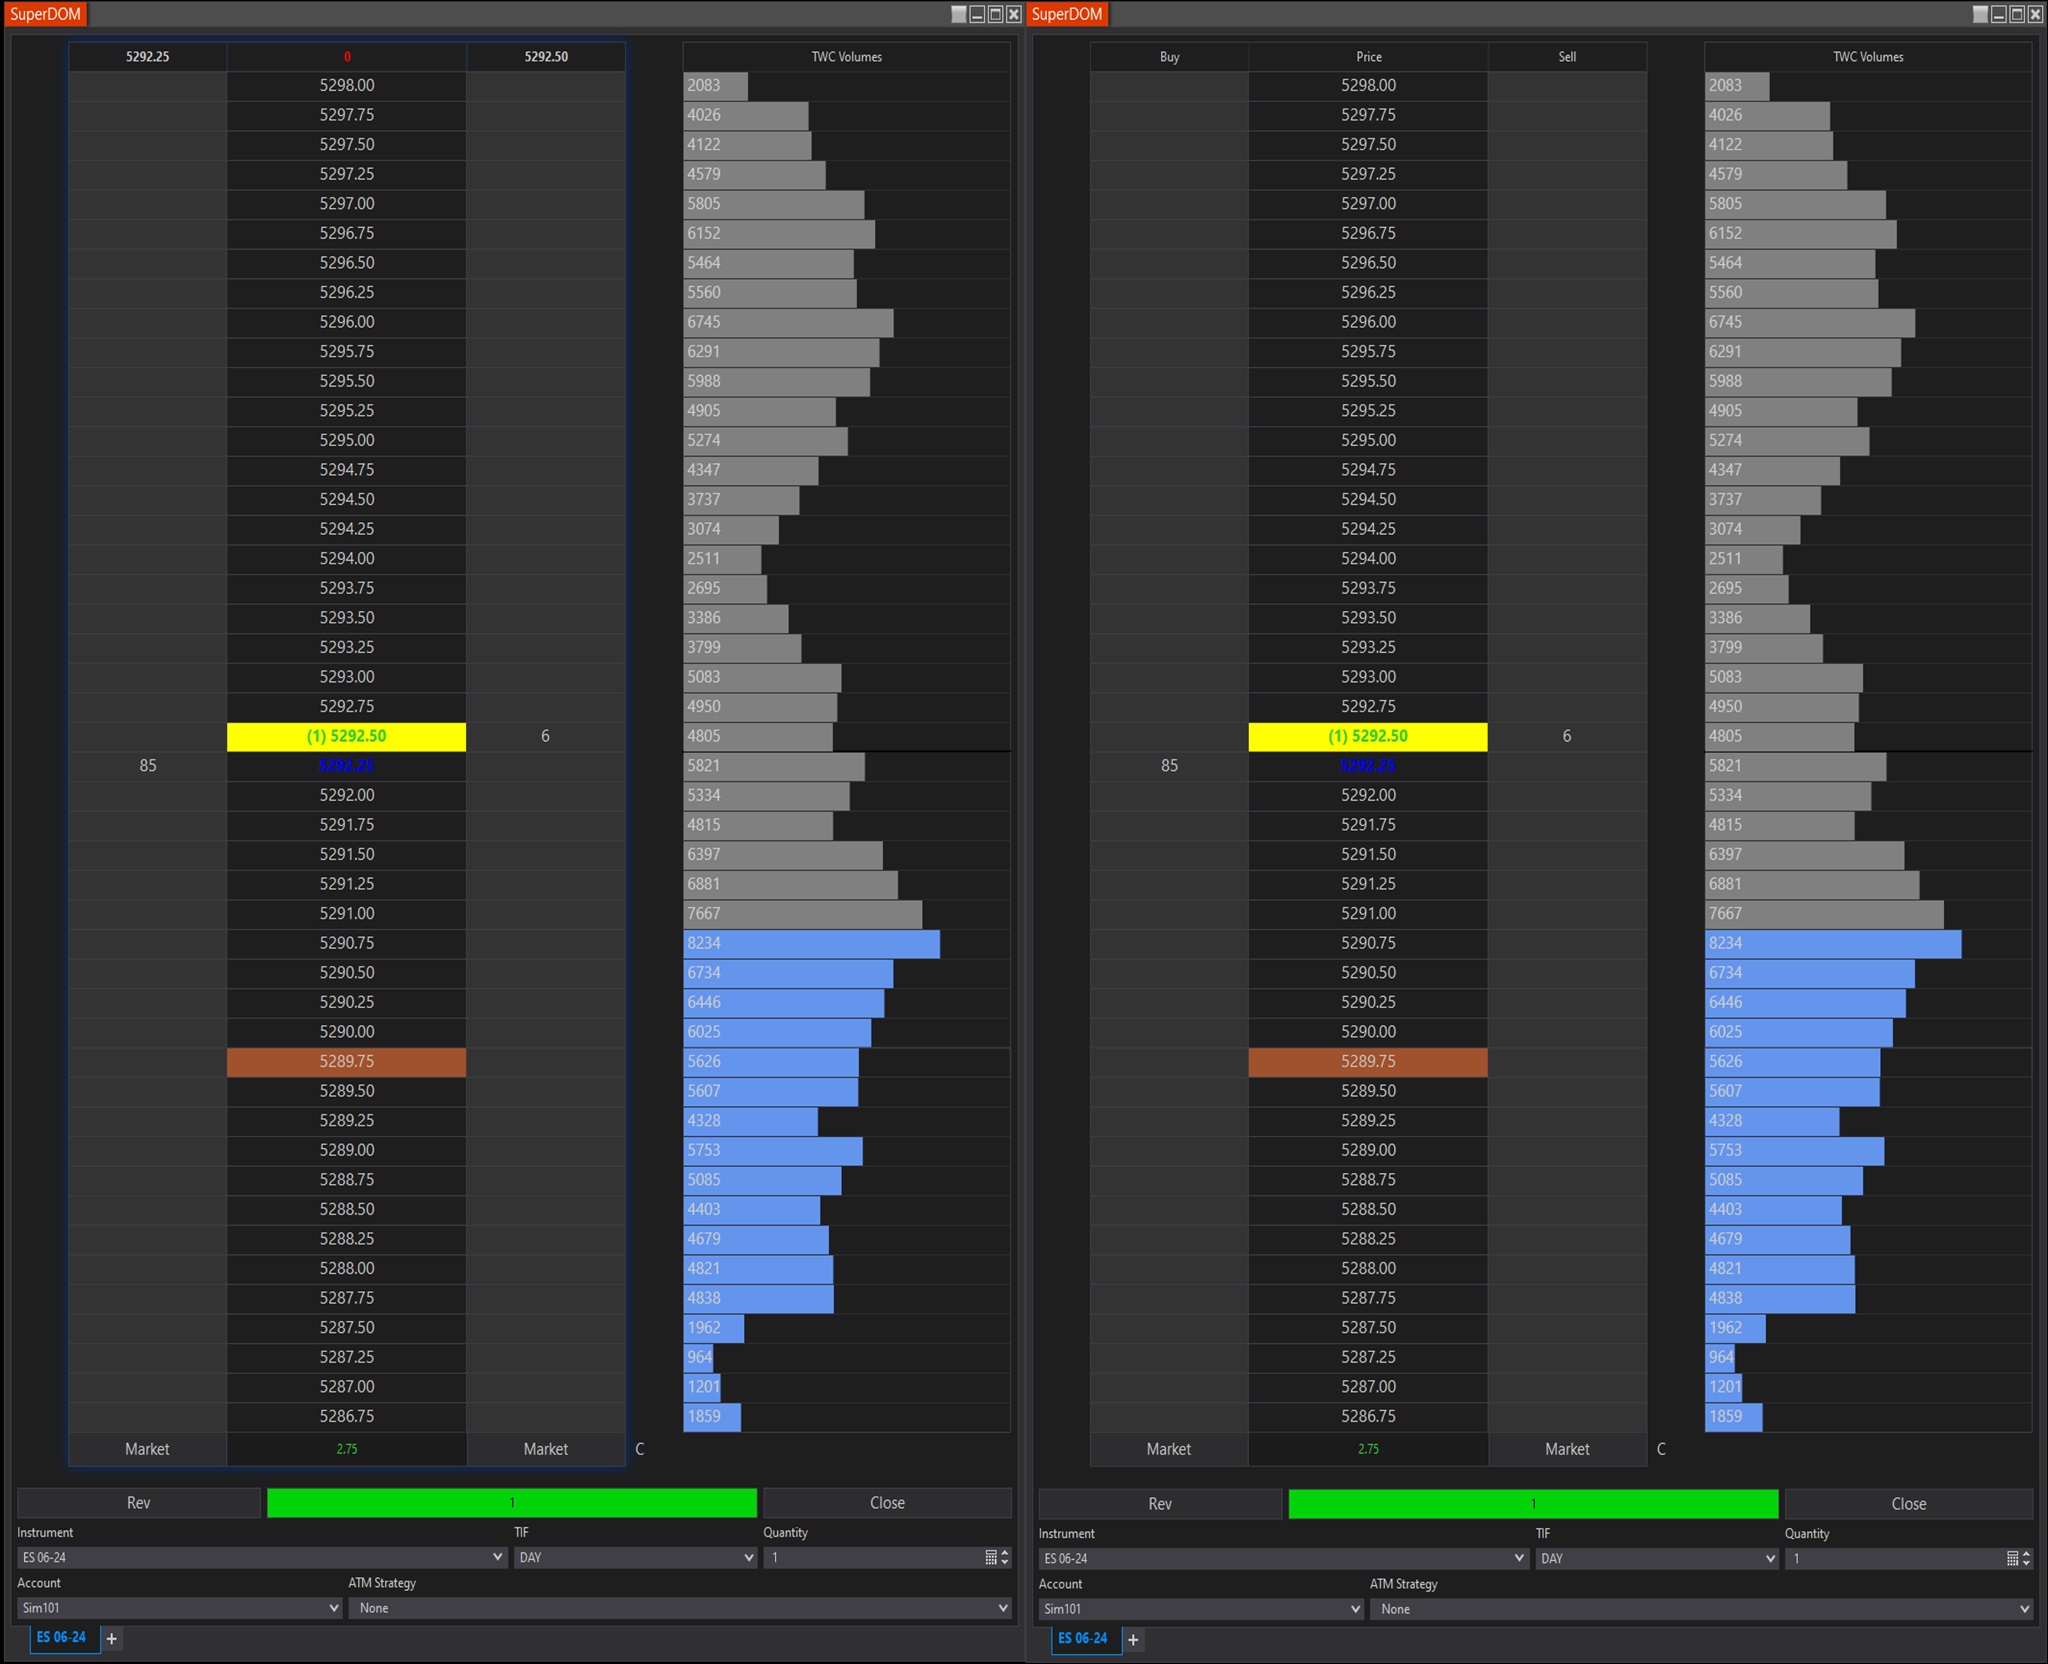
The value area reveals market sentiment by highlighting where most trading activity has occurred, aiding traders in understanding the prevailing market mood. It identifies key support and resistance levels based on trading activity, facilitating entry and exit points for traders.
You can download and try our best strategies for NinjaTrader 8 now! These strategies are free to try. 24-hour technical support and all future updates included. Watch video tutorials on strategy details and how to use them. Hurry! Click here to download and try now!
Grab this FREE 10-page guide today! Discover little-known chart settings that will have a huge impact on your trading consistency.
Spot the calm before the storm for both breakouts and breakdowns with this ultimate volatility indicator! Spot bullish accumulation and consolidation points before strong upward breakouts and continued bullish trends. Find points of failing strength at plateaus and tops before drops.
This indicator shows Breakout Tests or Breakout Pullbacks of broken support and resistance in real-time. As a beta feature you can also test Failed Breakouts. Use the Breakout Test indicator as a discretionary indicator in your day trading. Get started with a free 2-week trial today!
December 2, 2024
Mastering Sideways Markets With Auction Bars and Range Projections
November 19, 2024
Enhancing Your Automated Trading System: Key Insights from Best Pro Trade
November 14, 2024
NinjaTrader New Ecosystem Tools: October 2024 Edition
Enter Email for Updates