An innovative way to analyze trading opportunities. Contextual trading keeps traders on the right side of the market. Qualified supply/demand zones work in sync with institutional traders. Enter trades with the shift of momentum. Learn and trade. Schedule a free consultation with the coach.
YMI University is designed to pack the utmost essential content into one trading course. It's designed to give you a new level of understanding of how the stock market works, how to get started, and how you can utilize your abilities to excel and grow.
Experience the success of our automated trading strategy for yourself with a complimentary 14-day trial. The strategy is designed to recognize market reversals and make trades accordingly. The Auto-Trader is completely free to test during the trial period with full support and templates.
This course, in French, details the step-by-step path to profitability, from the basics of trading to order flow, and the best known indicators. This course is the result of months of work and years of experience. Satisfied or your money back for 14 days – try it out!
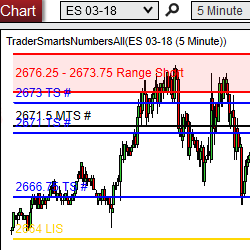
TS TradePlan is a precise support and resistance based trading plan, available for ES, YM, NQ, 6E, CL, and GC futures markets. Trade Plans are produced daily. Get started with a 2-week trial today.
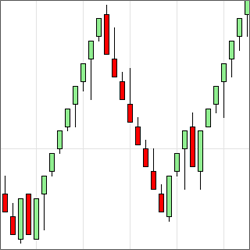
The Lucrum Vision Renko Bar reflects the actual price of the underlying instrument so you can be confident in its ability to accurately represent true price. Get accurate Renko charting for both live and backtested trading environments.
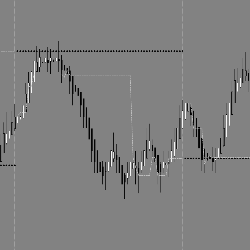
Q-GZone provides visual gap zones between the bars. Gaps occur when a significant imbalance exists between buy and sell orders. It can lead to a gap in the price as the market seeks to match these orders. The market tends to return to and fill in these gaps.
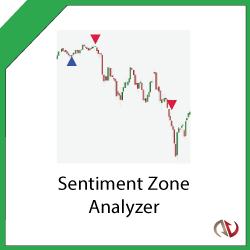
Use the Sentiment Zone Analyzer to measure overall market sentiment to spot trend reversals early! Based on the premise that extremely bullish or bearish tendencies will eventually lead to trend reversals. Dynamically calculates overbought and oversold levels based on previous price action.
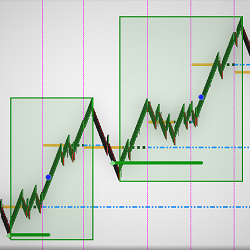
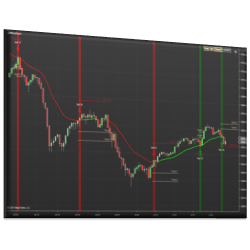
This indicator plots signals, targets, and stops based on support and resistance from various moving average types. The trend is established based on a minimum number of bars above or below the moving average. The signal is initiated on the first touch of the moving average.
EPyFVPOC is an indicator which displays in real-time the most traded price of the current day, as well as for any previous days loaded in your chart. It also indicates the Point of Control for the previous session, an important level for intraday traders.
December 2, 2024
Mastering Sideways Markets With Auction Bars and Range Projections
November 19, 2024
Enhancing Your Automated Trading System: Key Insights from Best Pro Trade
November 14, 2024
NinjaTrader New Ecosystem Tools: October 2024 Edition
Enter Email for Updates