Includes volume profile and TPO market profile, presets for one-click charting, daily, weekly, monthly, date, composite, and drawn profiles. Offers defined or continuous session types and load optimization. All of these features make it one of the most advanced profiles available on the market.
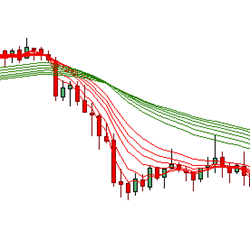
The Fanned Multiple Moving Average day trading indicator uses two sets of moving averages (long and short term) to calculate the probability of trend development, change, and direction. The FMMA reveals the nature of the trend and trend changes, which often reveals the starting point of a breakout.
Our custom indicators include automated plotting of trend wave counts, cycles (timing for entries and exits), momentum strength, support & resistance, divergence patterns and some Japanese candlestick patterns.
These are some free indicators that can help you gain an easier and more informed understanding of your trades. Risk calculator, easy entry, volume bar and trend indicators all may help you to avoid mistakes.
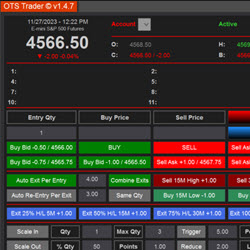
Uniquely streamlines your daily trading tasks, automating processes that would otherwise require manual effort. Organized into four key sections — first entry, second entries, auto stops and auto exits. Plus more.
With the book High Probable Japanese Candlestick Patterns, learn how to utilize trading patterns which help give you an edge in the markets. Available in both Kindle and paperback versions with full color charts & trading examples, this book is for traders of futures, forex, stocks and options.
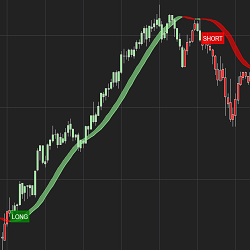
The HolyGrail Algo uses calculations of the Hull Exponential Moving Average to identify market direction. A long or short condition is printed on the chart and the strategy executes the trade by going long or short. You can set defined take profit, stop loss and trail and time of day to trade.
Samri Math RY Intraday is a purely PRICE-based indicator for traders who use Murrey Math methodologies. It works not just with time-based charts (day/minute/second), but also with other chart types such as Renko, Range, Volume and Tick. Multiple algorithms for calculating price levels are included.
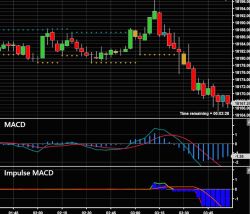
The Impulse MACD is a modified MACD that filters false signals and reduces the whipsaw in sideways markets. It helps find range bound patterns where it might be best to avoid trading and preserve capital. Simple. Don’t want to trade without a trend? Don’t trade when the Impulse MACD is flat.
The Smart Momentum NinjaTrader Indicator tool has a unique design compared to other momentum indicators. It uses an averaging mechanism that analyzes the cycle and adapts to it. This results in a momentum plot that is simultaneously smooth and sensitive.
December 2, 2024
Mastering Sideways Markets With Auction Bars and Range Projections
November 19, 2024
Enhancing Your Automated Trading System: Key Insights from Best Pro Trade
November 14, 2024
NinjaTrader New Ecosystem Tools: October 2024 Edition
Enter Email for Updates