This product is a automated bot strategy that work on NQ and MNQ only.
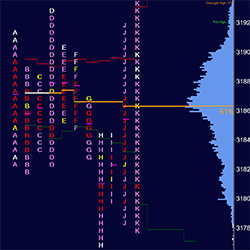
This is more than the classic Market Profile indicator available on the market today. All meaningful reference levels are automatically drawn for you. All Dalton market generated data have been programmed. Weak buy and sell levels, tails, poor extremes and much more!
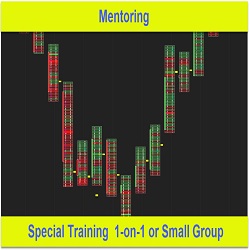
If you’re struggling with specific issues such as your entry or even your exit or developing a strategy that works for you, the first port of call is a free 15-minute consultation where we can discuss your needs and formulate a 1-on-1 mentoring plan. Reach out no matter what your trading issue is!
The VWAP Predator uses VWAP as a zonal guide with Bull and Bear Bands. It then uses logic to recognize accumulation and distribution candles. If those candles cross from a zone to another, then a Signal Candle is produced. Buy Signals in the Bullish Bands and Sell Signals only in the Bearish Bands.
Auto Tab adds a Tab Link Selector to the top left portion of every Dom & Chart window. Simply click on the tab of any window, and all other windows (linked by color) will also change to that same tab! Simulate multiple workspaces with tabs and enable automatic sequencing with a configurable timer.
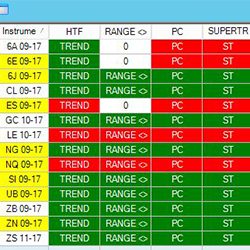
The JATS Market Analyzer Template for the NinjaTrader 8 platform has customized blackbox BloodHound solvers that show when momentum, linear regression and trend are in synchronization across multiple time frames.
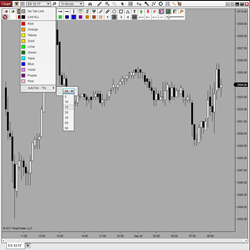
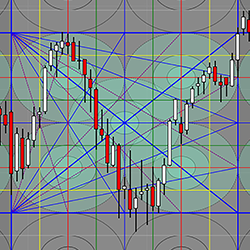
The Samri Math Diamond Grid is a drawing tool which is applied by drawing a square on a chart. The tool then automatically displays graphic elements which are based on calculations from the methodologies of Gann & Murrey.
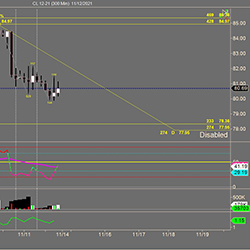
Fibonacci LevelsL Institutional Support and Resistance Levels by DTB Traders offer unparalleled accuracy for futures market trading. With automatic adjustments for new highs and lows, save hours on analysis across multiple instruments and time frames.
Learn to trade using a proven righthand trade method by trading two hours a day. 20 hour-long face-to-face sessions. Sessions are captured on video for repeat viewing. Includes candle patterns, harmonics, geometry and an intro to forecasting.
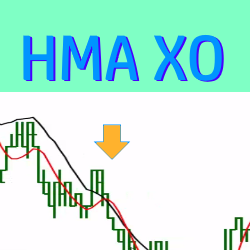
This trade setup indicator paints entry signals each time a Hull Moving Average (HMA) crossover occurs. The entry signals are customizable and can be filtered by the slope of the linear regression. Click here to watch a video and lean more!
December 2, 2024
Mastering Sideways Markets With Auction Bars and Range Projections
November 19, 2024
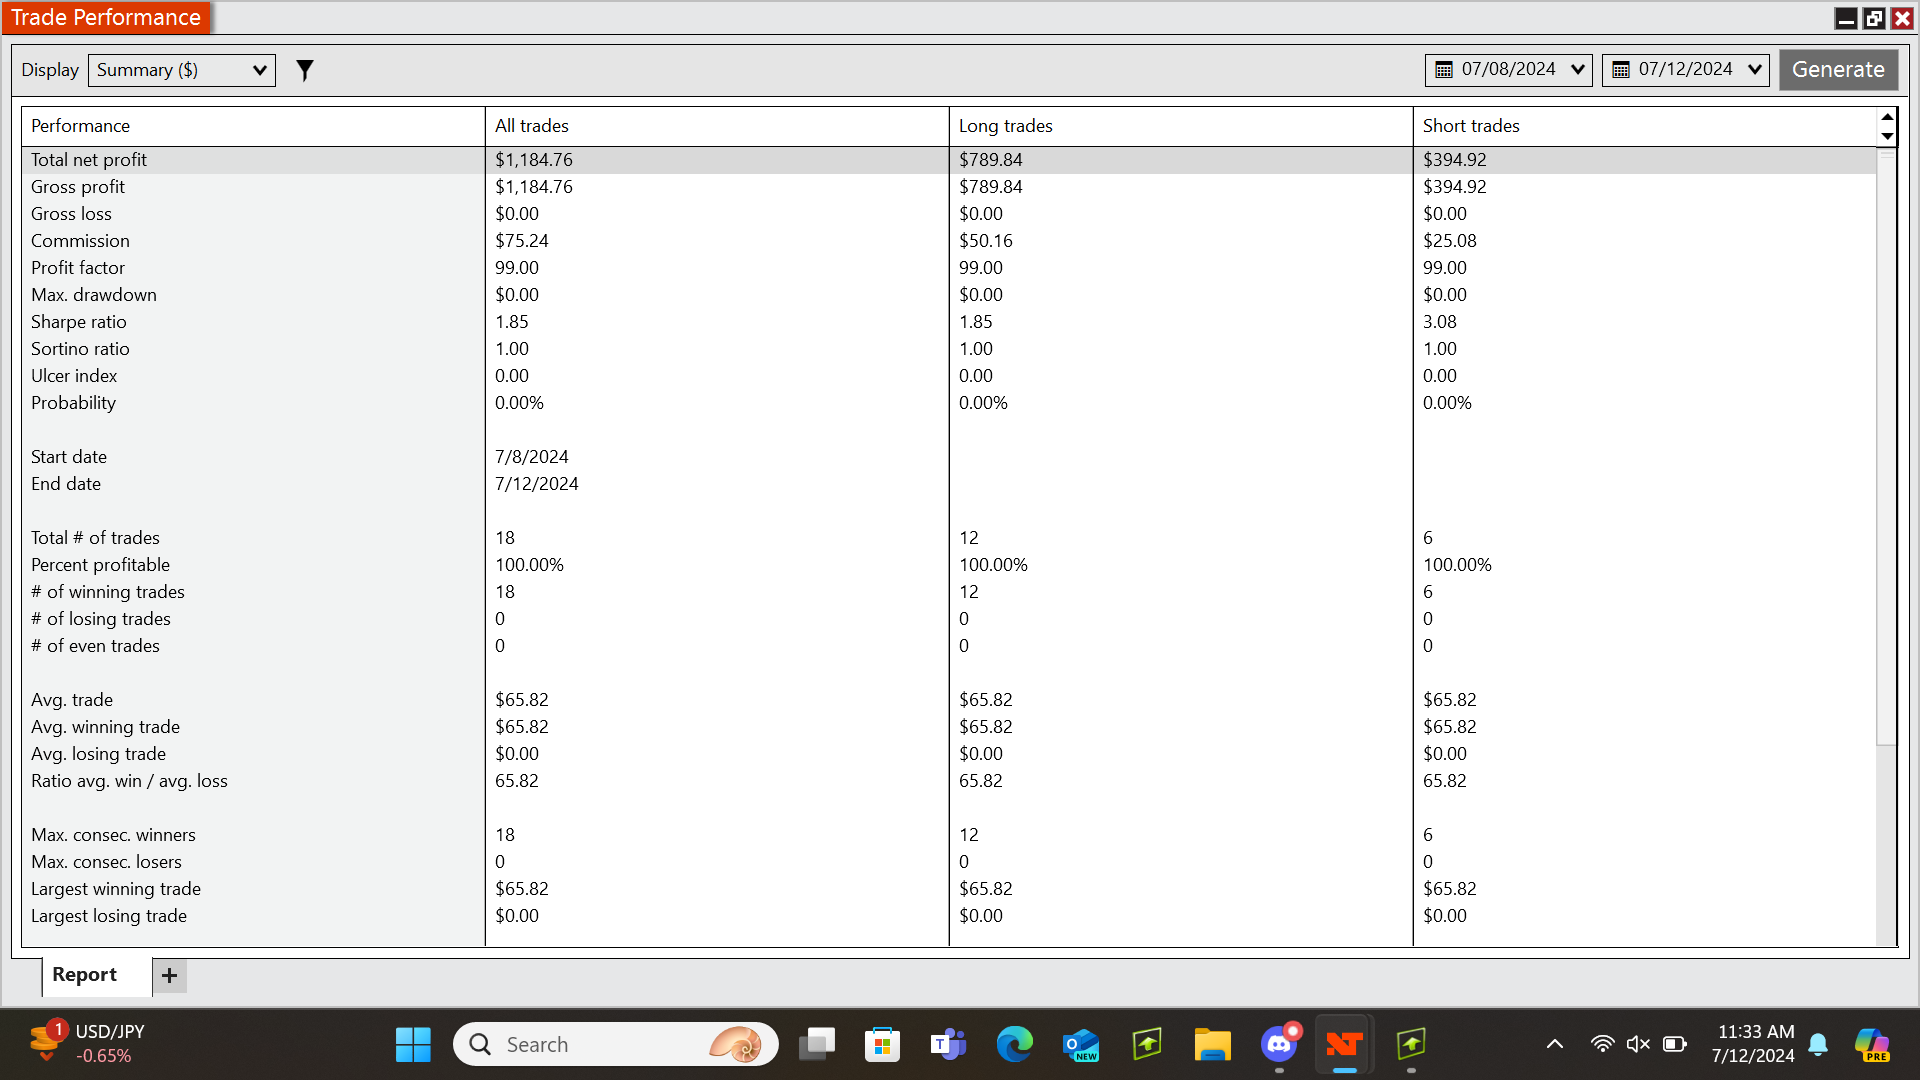
Enhancing Your Automated Trading System: Key Insights from Best Pro Trade
November 14, 2024
NinjaTrader New Ecosystem Tools: October 2024 Edition
Enter Email for Updates