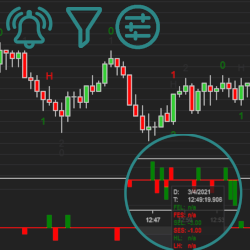
Alerts on two-legged pullback status. Fourteen price action signals: second entries, higher low, lower high, failed 2E, etc. Five filters and preferences: reset on double top, engulfing bars, risk limit, etc. Precise counting of second entry, Mack’s technique. Flexible setup. Start a free trial now.
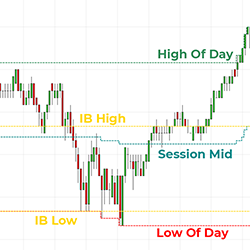
Initial balance, session mid & day mid are common market profiling levels used in day trading futures, stocks & ETF’s. This indicator automatically plots and updates these levels on any intraday chart, providing clear targets for trade entries & exits. Get started now and enhance your charts!
This ES S&P Day trading course uses Fibonacci technical analysis to identify entry and exit strategies. Rose has backtested for many years to determine the optimal Fibonacci Retracement and Extension levels for a consistent system. Get started with a free consultation with Rose!
Hey Overachiever, I see you! Don’t worry—you’re in the right place. You’ve made a habit of outperforming, so why not arm yourself with the best team to help continue your winning streak? We code (like hackers) and launch (like marketers) your products. Click and schedule a free consultancy call.
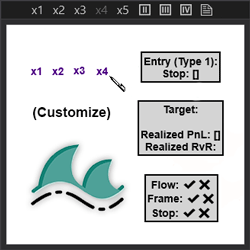
This indicator allows the user to create custom text buttons and quickly draw them on the chart, increasing application functionality and user charting efficiency.
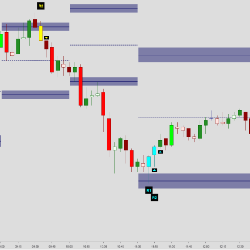
The Auction Bars indicator identifies higher time-frame ranges, displayed as Auction Ranges. These ranges show the current market value area of the ongoing auction. The accompanying congestion zones work as support / resistance where spike and reversal patterns frequently plot.
Master the market with this intelligent trailing indicator! Smart volume-based trailing algorithm identifies up and down trends. Perfectly suited to support “stop-and-reverse” as well as “always-in-the-market” trading styles. Discover the most consistent symbols with an instant performance graph!
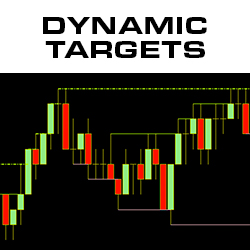
The Dynamic Targets indicator draws real-time lines at price points which serve as support and resistance, as well as entry, exit and stop adjustment targets. The data boxes provide key information to determine the relative strength of each support/resistance line. Download Dynamic Targets Today!
This model balances four separate risk lenses that seek to generate alpha while moderating standard deviation over multi-year periods. Each risk lens is independently applied based on Alpha Vee's breakthrough fundamental momentum research. Contact Alpha Vee for more information.
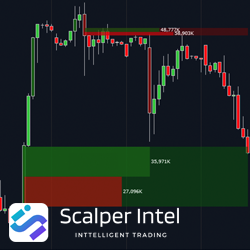
The Fair Value Gap (FVG) from ScalperIntel is an indicator that identifies inefficiencies (or imbalances) in the market and then marks the upper and lower limits of the gaps. The Bull and Bear FVG’s are plotted along with the bull/bear volume profile from the gap start.
December 2, 2024
Mastering Sideways Markets With Auction Bars and Range Projections
November 19, 2024
Enhancing Your Automated Trading System: Key Insights from Best Pro Trade
November 14, 2024
NinjaTrader New Ecosystem Tools: October 2024 Edition
Enter Email for Updates