The FiReZ Trading Strategy is an original and modern refinement of Fibonacci technical analysis. This Fibonacci trading strategy may be the last strategy that you'll need to learn. Stop making trading complicated and learn how to analyze and trade in a simplified, structured, and repeatable system.
CommoditySignal is an essential trading signal app for commodity traders, offering precise signals for Crude Oil, Natural Gas, Gold, and Silver. Experience a 3-day free trial to see its effectiveness firsthand. Available on both iOS and Android, CommoditySignal delivers timely insights.
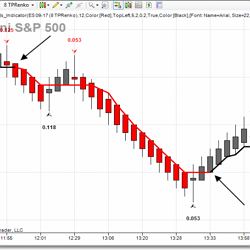
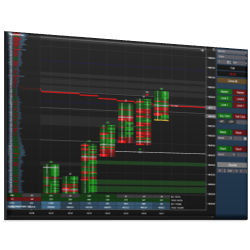
A simple 3-point system consisting of renko bars and two turning point trend indicators. The system is designed to enter trades late yet see positions through and avoid early exits. Includes fully automated strategy and indicator package. Free 30 day trials are available!
Trading123 AutoTrader is a fully automated trading algorithm that has been programmed to identify the trend. It includes entries, exits, profit targets, trailing stops plus profit & stop loss management. Designed to trade the futures markets, trend reversals and remove human emotion from trading.
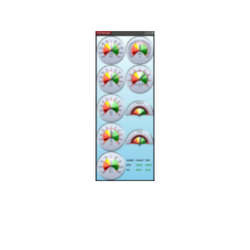
The CB Internals Panel shows you the breadth of the market long and short term. Combined with custom audio alert, it lets you know when the market is moving. It has been in development since 2016, and the current version stands alone.
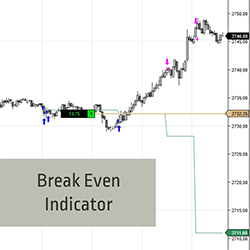
Want to hold on to trades longer? The Break Even indicator calculates profits taken into the average price of the remaining position. See the Break Even line move away from price & gain additional confidence to remain in your trade! It works for both long & short trades. Start your 2-week trial now!
Time Or Range is a custom bar type with intervals at a predetermined elapsed time span OR price action range.
Custom design. Custom actions. Create buttons that interact with standard NinjaTrader ATM strategy orders. Fully customizable, including button and font color and size as well as button width and position. Actions can be based on a wide variety of reference prices and offsets.
The Tradesight Live Trading Lab is a Discord channel that allows anyone to listen to live market commentary, view charts shared by Tradesight analysts, and ask questions throughout the trading day. It is a free service and available to anyone who downloads the Discord app on PC, Mac, web, or mobile.
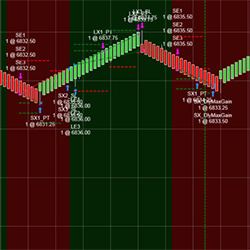
This indicator plots signals, targets, and stops based on support and resistance from various moving average types. The trend is established based on a minimum number of bars above or below the moving average. The signal is initiated on the first touch of the moving average.
December 2, 2024
Mastering Sideways Markets With Auction Bars and Range Projections
November 19, 2024
Enhancing Your Automated Trading System: Key Insights from Best Pro Trade
November 14, 2024
NinjaTrader New Ecosystem Tools: October 2024 Edition
Enter Email for Updates