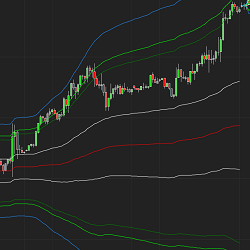
We have added two new products for market analyzer. One works in conjunction with DualTrend 2.0 to keep you aware what market is trending so you can trade with the trend. The other works with CB ZoneChart V5. It will let you know if your market is in the lower zone or Upper Zone.
Become a pro trader with four 1-on-1 trading sessions dedicated entirely to you! Learn price action via a 26+ chapter Price Action Trading Course. Detailed guides show you how to find signals & set up your charts to do much more. A lifetime membership, live daily analysis & chatroom are included.
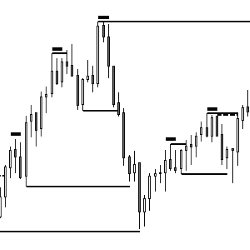
This indicator shows Double Bottoms and Double Tops which are tested by subsequent price action. It shows micro Double Bottoms & micro Double Tops as well. Use it as a discretionary indicator and for automated trading (e.g. BloodHound). Get started with a free 20-day trial today!
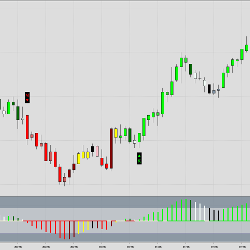
The Zerolag Oscillator is a MACD type momentum oscillator, based on two zerolagging moving averages. The indicator is designed for locating momentum and pullback entries. Momentum entries are found shortly after a trend change, whereas retracement entries focus on the middle chunk of a larger trend.
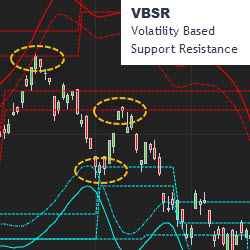
MetaSwing plots the hidden structure of support and resistance in real-time. VBSR (volatility based support resistance) makes this visible in advance, in all timeframes. Markets are non-linear and your tools should be as well. It’s not your father’s TA. Trial MetaSwing.
tickmatrix is a small team of disciplined and dedicated programmers who architect intermarket trading strategies, indicators, API and more.
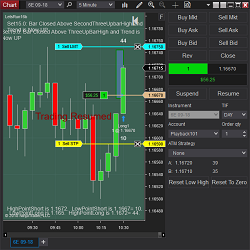
Let’s Run is a breakout strategy used for discretionary or automated trading with a Chart Trader switch. It triggers based on built-in trend finding indicators with customizable settings for stop options and reset buttons. It is fully flexible with both swing and scalp capabilities. Learn more!
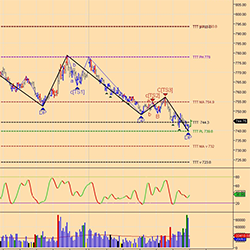
The TTT Lines Indicator extracts the information from the daily TTT E-Book report & plots the data directly on NinjaTrader charts. Quickly identify the TTT support and resistance levels plus more!
Mentor one to one what you'll find inside: 8 hours of live lectures, 4 hours of live backtest, community discord lifetime live weekly backtest, weekly live review, live archive, markup price action, lifetime updates on new concepts, private structure indicator.
tcVwap is an indicator for monthly, weekly and daily VWAP calculation. VWAP is an indicator representing fair price of a financial instrument. This is the Volume Weighted Average Price. The VWAP mean price is often used by institutional traders as a reference.
December 2, 2024
Mastering Sideways Markets With Auction Bars and Range Projections
November 19, 2024
Enhancing Your Automated Trading System: Key Insights from Best Pro Trade
November 14, 2024
NinjaTrader New Ecosystem Tools: October 2024 Edition
Enter Email for Updates