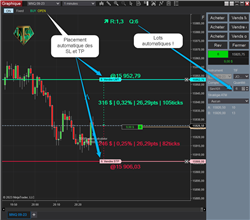
This indicator will automatically calculate for you the quantity of lots according to the position of StopLoss and the risk as a percentage of your capital. It will also place your StopLoss and TakeProfit. Finally get constant risk by trading on Futures contracts!
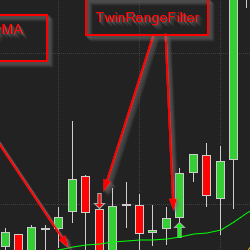
The Twin Range Strat employs two indicators (the Twin Range Filter and the RedKSmoothAndLazyMA) to genterate ATM Orders. The quantity, stops and trailing are all handled by the ATM and you, if you like!
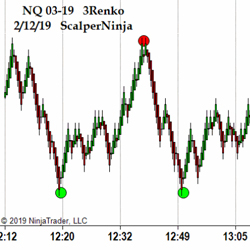
Scalper Pivot Point indicates reversals in real-time and on the FIRST TICK of the bar. If you understand the basics of how to read price action and are looking for an additional signal for entries and exits, then Scalper Pivot Point software is for you!
Live trading room for ES S&P 500 day traders. Based on Rose’s Fibonacci trading system, charts are posted and price action shared. Previous trades are reviewed so that students can improve. Discord chat room goals: help students become independent traders & provide a supportive community.
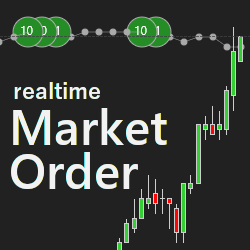
Dynamically see real-time market orders of buyers and sellers in the normal candlestick chart. Get a better feel for the market and its dynamics at the important price zones. Get started today with a two-week free trial!
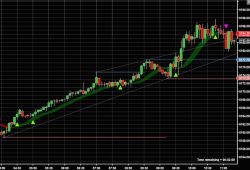
Trend Support & Resistance works great as a companion to the Trend Ribbon & Buy/Sell indicators. This indicator identifies support & resistance levels plus forecasts highs / lows. Helps you predict upcoming reversals with confidence. Adjust to your style of trading: intra-day, swing or longer.
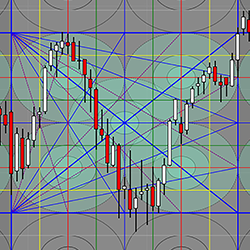
The Samri Math Diamond Grid is a drawing tool which is applied by drawing a square on a chart. The tool then automatically displays graphic elements which are based on calculations from the methodologies of Gann & Murrey.
The Easy E-mini E-book package details specific trade setups using standard indicators that are available with every download of NinjaTrader. The package comes pre-designed workspaces and templates, unlimited video library access & a 3-day chat room trial!
The Roller Coaster is a Stochastic/MACD cross indicator with special EMA Points of Control for both long and short trades. Our algorithm works everything out behind the scenes, keeping your chart clean.
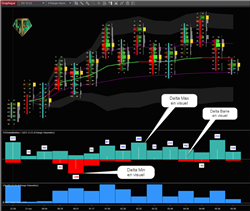
This indicator will visually tell you the evolution of this OrderFlow data: Delta / Delta Min / Delta Max. Ideal for detecting Delta divergences. No need to read the NinjaTrader statistics table anymore! Please note, you must have the NT8 version allowing access to OrderFlow.
December 2, 2024
Mastering Sideways Markets With Auction Bars and Range Projections
November 19, 2024
Enhancing Your Automated Trading System: Key Insights from Best Pro Trade
November 14, 2024
NinjaTrader New Ecosystem Tools: October 2024 Edition
Enter Email for Updates