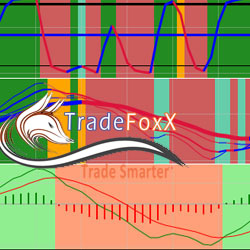
Suite of four complementary indicators provides entry and exit alerts while offering valuable price momentum insights. These indicators can be integrated with your preferred setups and present price momentum in a visually engaging, color-coded format.
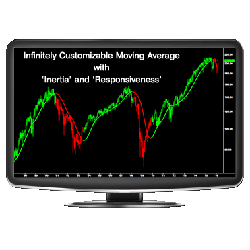
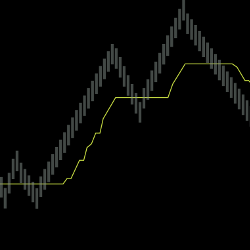
The ZMA™ is the most adaptable and customizable moving average indicator to date. By using an algorithm that incorporates the concepts of inertia, energy, and responsiveness, the ZMA is infinitely flexible and significantly more effective than other moving averages available.
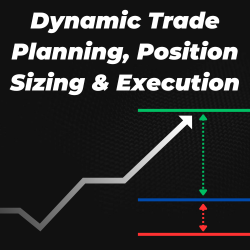
Plan & manage your trade with draggable entry, take profit, & stop loss levels. Auto-calculate & execute position size based on risk management parameters (fixed dollar, % balance, fixed contracts). Includes fixed risk reward, move to breakeven & max contracts features–the all-in-one trading tool.
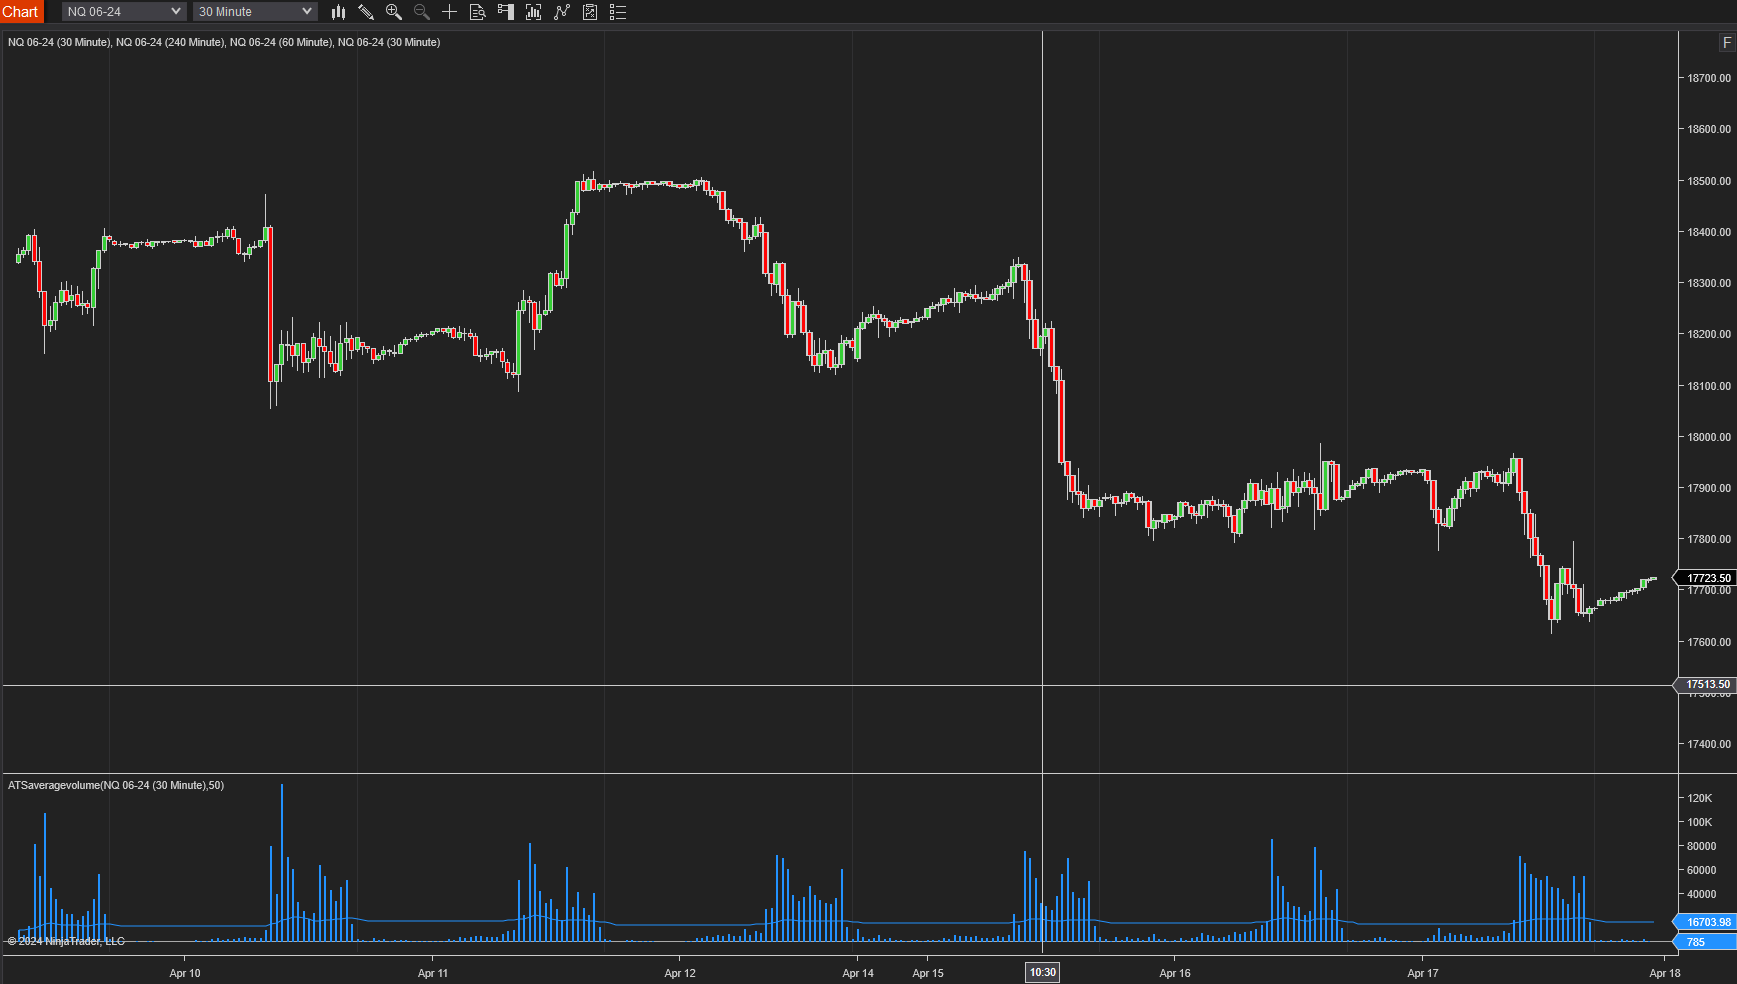
This indicator plots a 50-bar average of the volume overlaid on the current volume. You can change the number of bars used to calculate the average.
The EPyFToolbar provides the capacity to execute many commands with a single click, such as enable/disable Chart Trader, hide all indicators from your chart, hide past trades, hide drawing objects, and more. Simply load the toolbar in one chart window and it will appear in every tab.
This NinjaTrader indicator is programmed to highlight the big money trades. The numbers are placed under each bar which makes it easy to see where the action/noise is taking place.
Introducing a groundbreaking "Future Signal Zone" concept, the system predicts Support/Resistance zones ahead of the present price. With compatibility across different chart types, ZoneGPT * From The Future assures adaptability, addressing both trend riding and pinpointing reversals.
Click Trader is designed for quick and efficient chart trader order entry. Enter and manage trades with one click. No more working with the right-click menu. Sync multiple stops or targets to the same price in a single click. Works with ATM strategy stops and targets.
The LogikUltimateRenko is a completely customizable improved variant of the traditional Renko bar type. It has the added options to set the Open Price Relation (to the prior bar), as well as a more precise Reversal Brick Size control. Check out a video demonstration of LogikUltimateRenko in action!
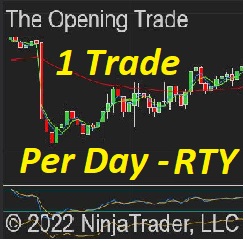
With a potential of 1 trade per day, this system is automated from start to finish & designed to be monitored in some capacity. If you can remotely access a computer with the right software, then you can monitor these automated trades from the golf course (with a strong cell signal).
December 2, 2024
Mastering Sideways Markets With Auction Bars and Range Projections
November 19, 2024
Enhancing Your Automated Trading System: Key Insights from Best Pro Trade
November 14, 2024
NinjaTrader New Ecosystem Tools: October 2024 Edition
Enter Email for Updates