The EPyF Trading Room is made up of a team of traders focused on the study, analysis & trading of the futures market with the EPyF System. Inside you´ll learn, share and grow with a group of traders who have the same vision & philosophy of the market. Join and get access to our chat and indicators!
The LogikDynamicRange is a unique Range Bar with Dynamic Resizing capabilities. This is done by employing a non-lag range determination technique, continuously adapting the bar size throughout the day, capturing trends while displaying consolidation areas very easily.
The indicator illustrates volume delta for each bar, emphasizing the contrast between buy and sell volumes. With compatibility for historical and real-time data, it offers diverse display modes. Importantly, users can filter volumes to uncover distinctive behaviors among specific trader groups.
Innovation in Momentum: SPEARHEAD is a cutting-edge indicator for traders and investors. It compares the momentum of two instruments, with one being a custom synthetic instrument created by the user, incorporating up to seven assets like stocks, commodities, currencies, etc. Also in Spanish.
Volume Profile is a very well-known and very much-used indicator in trading, but with a twist! Our indicator will give you the ability to automatically anchor it to various starting points and, better yet, use it in your automated strategies and backtesting.
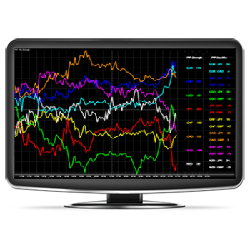
Gain an edge over the competition with FX indicators that calculate the Stochastics, RSI, DMI, ADX, ATR, and Verticality of each currency! The Fibozachi Forex Force indicators tell you exactly which currencies are the strongest and weakest, and which pairs have the most favorable correlations!
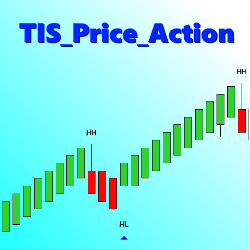
The TIS_Price_Action indicator detects and ranks pivots, then looks for a user specified sequence, such as Highest Low followed by Highest High to paint a long signal. Users can trigger 1 to 3 pivots to trigger a signal.
Market Analyzer 96 Trade Systems is a framework of 96 easy-to-use trade systems to test market conditions. With this course you will be able to extend the provided framework and use it as a powerful tool for building trade systems.
Master the market with this intelligent trailing indicator! Smart volume-based trailing algorithm identifies up and down trends. Perfectly suited to support “stop-and-reverse” as well as “always-in-the-market” trading styles. Discover the most consistent symbols with an instant performance graph!
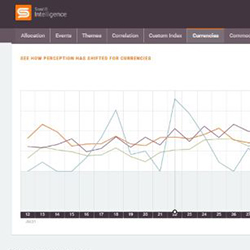
Sentifi's crypto sentiment analytics detect sentiment shifts in real time from over 500 million tweets and 2 million news and blog articles published worldwide every day. Sentifi mines this vast pool of data for investment insights to inform how market momentum is shifting ahead of price movements.
December 2, 2024
Mastering Sideways Markets With Auction Bars and Range Projections
November 19, 2024
Enhancing Your Automated Trading System: Key Insights from Best Pro Trade
November 14, 2024
NinjaTrader New Ecosystem Tools: October 2024 Edition
Enter Email for Updates