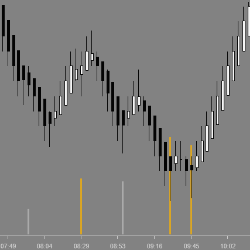
EPyFMomentumCandles is an indicator which helps to detect momentum. When a setup is confirmed by a momentum candle, we pay special attention as this is an important factor in our analysis. This indicator is also used to identify relevant areas during each session.
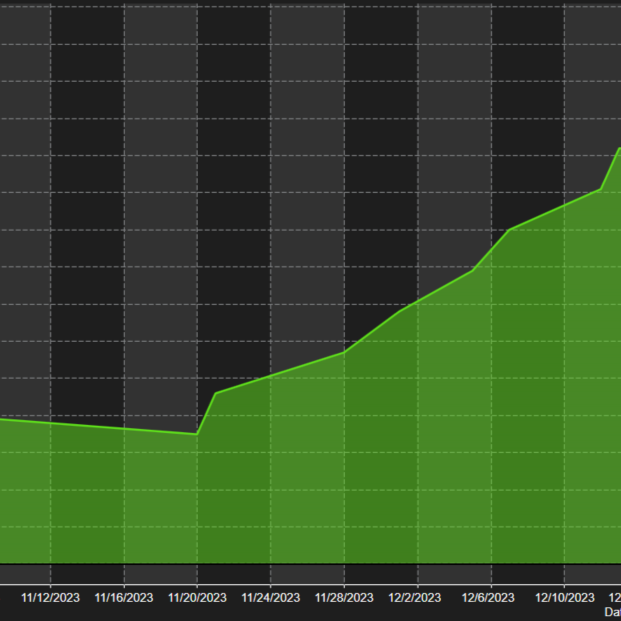
This automated trading strategy is designed for the Russell 2000 futures market. The strategy is easy to use, making it suitable for both experienced traders and beginners. Find out more on www.russell2000strategy.com.
QuantVPS provides ultra fast, reliable, and secure virtual private servers optimized for algorithmic trading. With instant setup and 24/7 support, their servers ensure your trading systems run efficiently, reducing latency and ensuring uptime. Optimize your execution with QuantVPS.com.
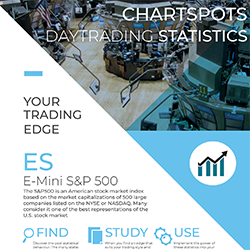
Use Statistics to determine intraday High Probability Targets and place stops outside of the regular market noise. This includes Stats on Initial Balance, Mid, Session & Extension ranges, as well as 1-minute rotations & many more! Available for ES, NQ, FDAX & FESX. Download your free report now!
The Intentional Trader’s most popular "heads-up display" indicator. Get a signal when a confluence of order flow, price action, divergence and exhaustion indicate that price could pullback from the current trend. See this indicator in action with a five-day trading room free trial.
12tradepro.com provides advanced, highly predictive, and reasonably priced software for trading global financial instruments in multiple time frames. Our technologies incorporate rule-based discretionary, semi-automated and fully automated approaches.
A unique course with a specific, rule-based & mechanical/objective trading methodology. Designed to help traders identify entries & exits, define size, manage risk and control emotions when trading Equity Markets with their own characteristics & terminology. Get FREE access to the patented AutoUFOs®
The Tradesight Seeker and Comber tools for NinjaTrader use a specific bar counting approach to measure exhaustion points. The tools work on all charts and in the Market Analyzer in NinjaTrader.
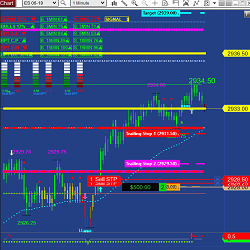
Neural Director advises trade direction and when to enter with the Golden Signal indicator. This toolset includes a predesigned workspace, accurate daily Power Fibs for many futures and forex markets, automatic Fibonacci extensions and automatic ATM entry.
Elevate your trading strategy with the DR/iDR Indicator for NinjaTrader: Your essential tool for identifying key price levels. This advanced indicator displays both the Daily Range and the Implied Daily Range directly on your trading charts, providing crucial insights.
December 2, 2024
Mastering Sideways Markets With Auction Bars and Range Projections
November 19, 2024
Enhancing Your Automated Trading System: Key Insights from Best Pro Trade
November 14, 2024
NinjaTrader New Ecosystem Tools: October 2024 Edition
Enter Email for Updates