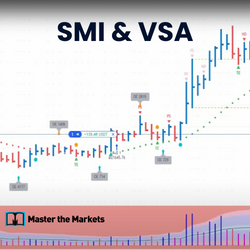
SMI was developed by the quants in the 1960's to help quantify tops and bottoms. It gives 3 strategy stats based on probabilities. However, a small limitation of the SMI is in selecting the T&Bs that are going to run. VSA helps you overcome that by looking at the volume for a big move.
Quintalytics develops custom trading software for retail and institutional traders, brokers and other industry professionals for both NinjaTrader 7 and NinjaTrader 8. We have utilized and developed hundreds of custom indicators and trading strategies over 20 years. We can also modify and optimize.
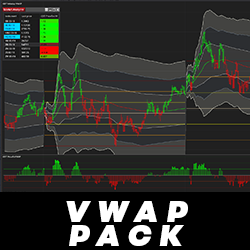
The VWAP Pack includes a VWAP Indicator with current and previous levels, a Price to VWAP indicator to output the position of price, and a Market Analyzer template! With the Price to VWAP indicator, it is easy to monitor the position of price in relation to the current VWAP.
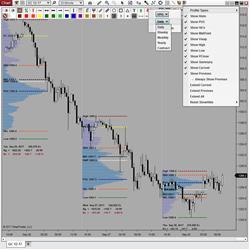
Volume Profile Sessions features 5 Profile Durations (Daily, Weekly, Monthly, Yearly, Contract) and 3 Modes of Calculation (bar/min/tick). It displays 8 Levels of Significance (VPOC, VA's, VWAP, High/Low/Mid, PClose) & session summaries, and provides simple configuration thru a toolbar icon!
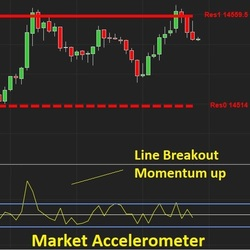
The E.G. AI Accelerometer reveals the driving force behind the price movements of an asset; by measuring how many buyers and sellers are in a market, it helps you form a view of the future direction of the price and – crucially – how fast that movement may be.
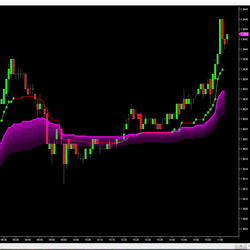
DTB River is an implementation of DTB Waves on non-time based charts and the results are plotted on time-based charts. It provides an added layer of noise filtering for waves. During the consolidation phase DTB River flattens out.
Get all of the most critical indicators in one package. Market Levels provides VWAP, Value Area High/Low, Point of Control, Initial Balance, Open, High, Low, Close and more helping you identify key price areas. Levels are plotted for the full session and a user customized session.
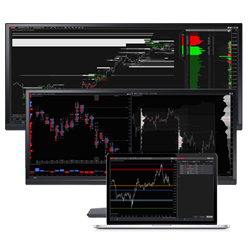
Rancho Dinero's full suite of Acme-brand volume, time, price and order flow analysis tools provide you everything you need to gain deep insight into your markets from multiple perspectives. Study your instruments. Strategize & define your risk. Stalk your trades and when opportunity knocks, strike!
Manage your risk by setting drawdown limits and goals! If your drawdown limits are hit, the system prevents you from trading further. If your goal is hit, you can trade but never giving back more than your set amount. If hit, you're done for the day/week. This is your preset Dynamic Drawdown Limit.
Fear and anxiety are common trading emotions. They can turn an otherwise profitable strategy into one that is constantly losing. The goal of Traderistic is to put an end to this frustration by monitoring the body and raising awareness of stress so that one can begin trading to their full potential.
December 2, 2024
Mastering Sideways Markets With Auction Bars and Range Projections
November 19, 2024
Enhancing Your Automated Trading System: Key Insights from Best Pro Trade
November 14, 2024
NinjaTrader New Ecosystem Tools: October 2024 Edition
Enter Email for Updates